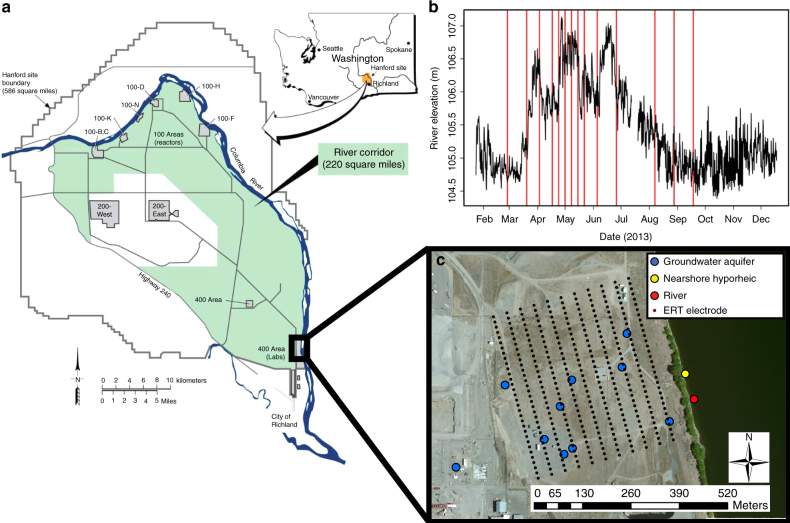
Fig. 2.
Spatial and temporal sampling design. a The location of the Hanford site within Washington State and the location of the Hanford 300 Area field site, reproduced from Stegen et al.1. b The Columbia River elevation near the field site throughout 2013; vertical red lines indicate sampling times. Sampling times targeted the most dynamic parts of the hydrograph and are not, therefore, evenly spaced. c Sampling locations within the field site where colors indicate different types of sampling locations; red indicates where water was sampled from the river water column, yellow indicates where nearshore hyporheic zone water was sampled from a piezometer placed 1 m below the riverbed, blue indicates where water was sampled from wells accessing the top of the groundwater aquifer, and small black circles indicate locations of geophysical electrodes; map was made using ArcMap 10.4

