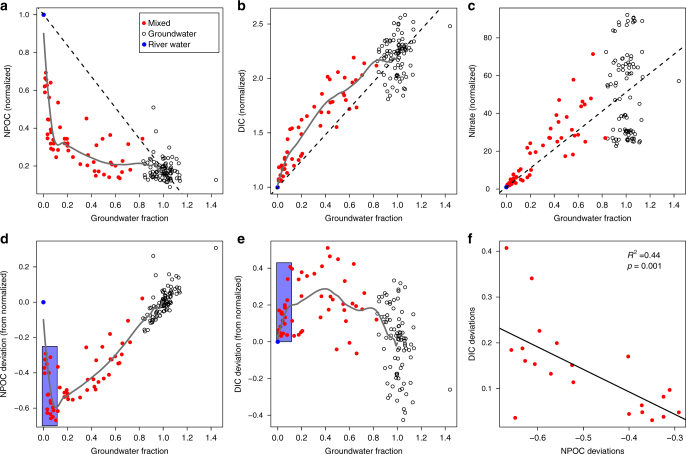
Fig. 3.
Reactive solutes and groundwater fraction and mixing model deviations. a–c Reactive solutes as functions of groundwater (GW) fraction inferred using Cl– as a conservative tracer. Linear mixing model expectations are indicated by dashed lines; gray lines are spline fits. River water (RW) concentrations of reactive solutes varied through time. Concentrations at each point in time were thus normalized to the associated RW concentrations; RW samples (blue circles) are always at 1 on the vertical axes. Cl− concentrations varied across GW wells (open circles) such that a threshold concentration was selected to indicate pure GW; non-river samples with Cl− concentration below this threshold were considered mixed (red circles). DOC, dissovled organic carbon; DIC, dissolved inorganic carbon. d, e Deviations from the DOC and DIC mixing models as functions of GW fraction. The purple rectangles on both panels indicate the range of conditions across which DOC deviations become increasingly negative. f DIC and DOC mixing model deviations within the purple rectangles are regressed on each other, revealing a significant negative relationship; the solid line is the regression model and statistics are provided on the panel

