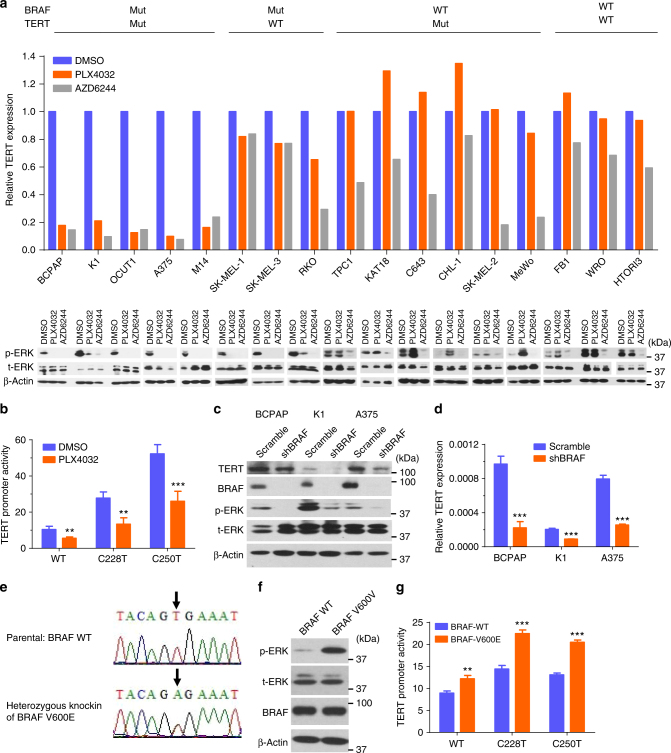
Fig. 2.
BRAF V600E/MAPK pathway regulated TERT expression. a TERT expression was analyzed by qRT-PCR in cells treated with 0.5 μm PLX4032 or 0.2 μm AZD6244 for 24 h (upper panel). The corresponding levels of phosphorylated ERK (p-ERK), total ERK (t-ERK), and beta-actin were detected by western blotting (lower panel). The relative TERT mRNA expression levels were normalized to the DMSO control group. b Luciferase reporting assay of TERT promoter activities in K1 cells treated with DMSO or PLX4032 (0.5 μm). c, d Specific shRNA against BRAF were used to knock down BRAF in thyroid cancer cell lines BCPAP and K1 and melanoma cell line A375. Scramble shRNA was used as control. Cells were then subjected to western blotting (c) and qRT-PCR (d). e Sequencing of the BRAF exon-15 in the parental and heterozygous BRAF-V600E knock-in SW48 cells. BRAF V600E was knocked in on one allele of BRAF by rAAV technology through homologous recombination and Cre recombinase of the Neo cassette. f Western blotting analyses of phosphorylation of ERK (p-ERK), total ERK (t-ERK), BRAF, and beta-actin in the parental and BRAF-V600E knock-in SW48 cells. g TERT promoter luciferase reporter assay in SW48 cells with/without BRAF V600E knock-in. **P < 0.01, ***P < 0.001, by two-tailed Student’s t test. P values are for the comparison of the indicated condition with DMSO (panel b), scramble (panel d), or BRAF-WT groups (panel g). All the values represent the average ± standard deviation (SD) of triplicate samples from a typical experiment. All the experiments were performed three times with similar results

