Fig. 2.
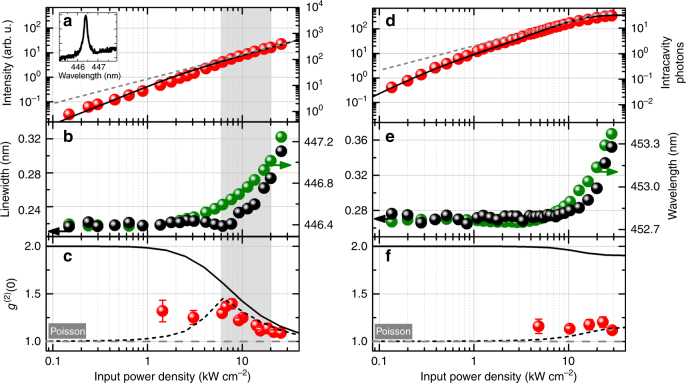
Room temperature optical and quantum-optical characterization of a lasing and a non-lasing III-nitride nanobeam cavity. a, d Room temperature I–O curves. The theoretical model (solid line) in a shows a slight nonlinearity before converging to a slope of 1 (indicated by the dashed line). Inset in a: Fundamental cavity mode at 0.64 kW cm−2. The I–O characteristic in d is governed by non-radiative losses and does not show an s-bend before saturating. The increased output intensity with respect to a is indicative of an increase in light scattering towards the vertical direction. Note that the intracavity photon number is higher for the lasing nanobeam, which allows building up a coherent photon population. b, e Resonance peak wavelength (green) and linewidth (FWHM, black). Above about 10 kW cm−2 the development of resonance wavelength and emission linewidth is dominated by heating of the cavity region. The lasing structure in b exhibits a slight decrease in linewidth around P ≈ 5 kW cm−2. c, f Second-order autocorrelation function at zero time delay as obtained from experiment (data points) and theory. Proof of the transition to coherent emission (shaded excitation range) is provided by the power dependence of the deconvolved second-order autocorrelation data, showing a clear trend towards the Poisson limit (g(2)(0) = 1) with increasing excitation power density. In contrast, the power dependence in f reveals a constant g(2)(0) ≤ 1.2. The evolution of the photon statistics is well reproduced by the microscopic theory (ideal: solid line, convolved: dashed line), when taking into account the calculated coherence time and the convolution with the temporal resolution (~225 ps) of the HBT setup. Error bars in c and f indicate the standard deviation obtained from fitting the recorded histograms that mirror g(2)(τ)

