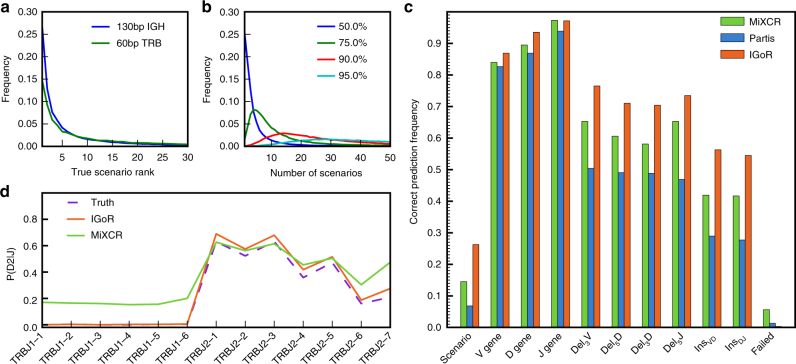
Fig. 4.
Probabilistic analysis of putative recombination scenarios and comparison to existing methods. Synthetic 130-bp reads of recombined hypermutation-free IGH sequences and 60-bp reads of TRB sequences were generated with a 5 × 10⁻³ error rate, and processed for analysis by IGoR and two existing methods, MiXCR8 and Partis10. IGoR ranks putative scenarios by descending order of likelihood. a Distribution of the rank of the true scenario as called by IGoR for both TRB and IGH. Note that the best-ranked (maximum-likelihood) scenario is the correct one in less than 30% of cases. b Distribution of the number of scenarios that need to be enumerated (from most to least likely) to include the true scenario with 50% (blue), 75% (green), 90% (red), or 95% (cyan) confidence for IGH (see Supplementary Fig. 10 for equivalent figure for TRB). c Frequency with which IGoR, MiXCR, and Partis call the correct scenario of recombination as the most likely one (“scenario”) in hypermutation-free IGH, as well as each separate feature of the scenario (“V gene,” etc.). “Failed” corresponds to sequences for which the algorithm did not output an assignment. d Usage frequency of TRB D gene conditioned on the J gene, inferred by the IGoR and MiXCR (Partis does not handle TCR sequences). IGoR recovers the physiological exclusion between D2 and J1, while MiXCR does not

