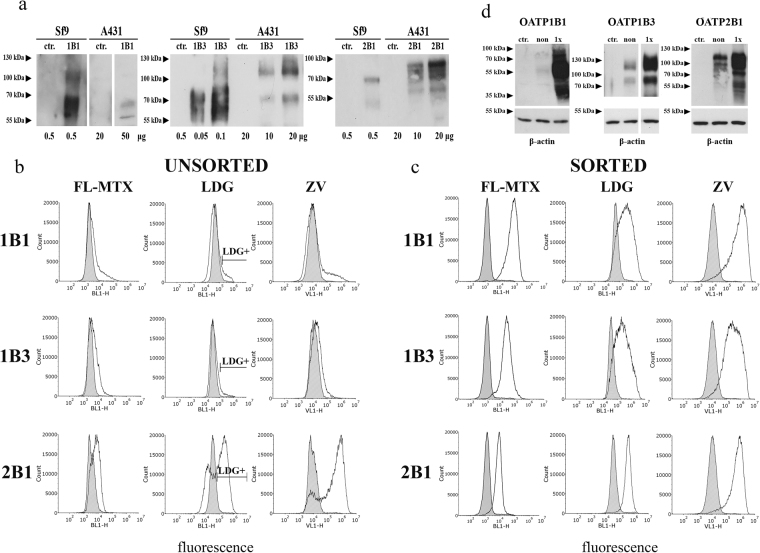
Figure 2.
Low level of OATP1B expression in A431 cells. (a) Western blot detection of human OATPs expressed in insect and A431 cells. Total cell lysates were analysed by Western blot. Control (ctr.) represents Sf9 cells expressing an unrelated protein or mock transfected A431 cells. Multiple migratory bands most probably represent differently glycosylated forms of OATPs. Figure for OATP1B1 was sliced from the same blot, same exposure time. Full-length blots are presented in Supplementary Figure 7. (b) Fl-MTX, LDG and ZV uptake in A431 cells. Representative histograms show the uptake of 1 µM Fl-MTX or 0.4 µl LDG or ZV into A431 cells before and after sorting. Cells with the highest LDG fluorescence were sorted, and after recovery, the cells were again measured for LDG uptake (panel c). Mock transfected control cells are indicated by filled histograms. Cells were incubated with the substrates for 15 minutes (Fl-MTX) or 30 minutes (ZV, LDG) at 37 °C in uptake buffer (pH 5.5) in final volume of 100 µl. Living (PI-negative) cells are shown. (d) LDG sorting results in increased expression of OATP1B1, 1B3 and 2B1. OATP expression was determined using whole cell lysates (20 μg each) by Western blot. A431 mock transfected cell lysates were used as control. β-actin served as an internal control. Experiments were repeated at least twice. One representative blot is shown. Ctr.: mock-transfected, non: non-sorted, sort: sorted. Multiple migratory bands most probably represent differentially glycosylated forms of OATPs. Full-length blots with different exposition times are presented in Supplementary Figure 7.

