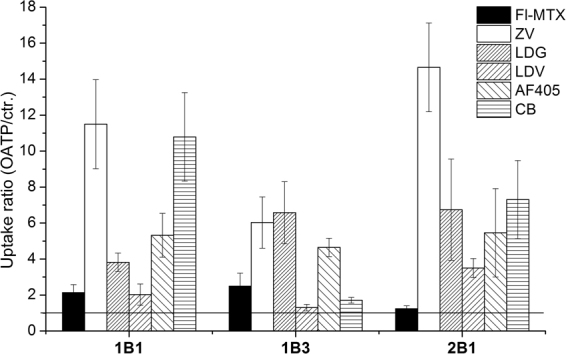
Figure 3.

Screening identifies additional fluorescent OATP substrates. Transport was determined in A431 cells expressing OATP1B1, 1B3 or 2B1 seeded in 96-well plates. The cells were incubated with 1 µl ZV, LDV, LDG, 1 µM (or 4 µM for OATP2B1) Fl-MTX or 20 µM CB and AF405 for 30 minutes at 37 °C in buffer with pH 5.5, in final reaction volume of 100 µl. Fluorescence was determined using an Enspire fluorescent plate reader. Activity was calculated by dividing fluorescence measured in A431-OATP cells with that measured in A431 mock transfected cells. Average of at least three independent measurements with triplicates ± SD values are shown.
