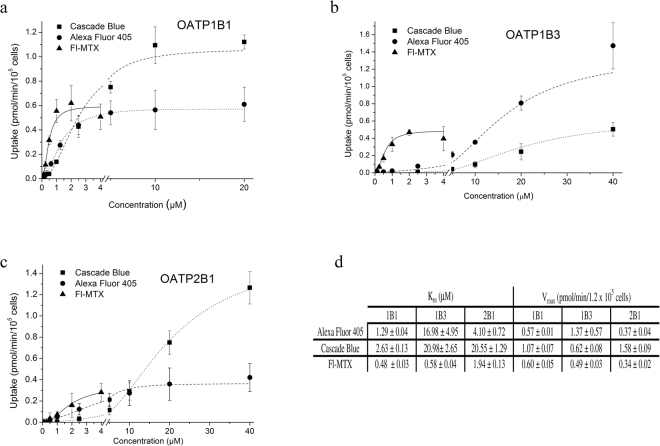
Figure 4.
Kinetics of uptake of CB, AF405 and Fl-MTX in A431 cells overexpressing OATP1B1, 1B3 or 2B1. Transport was measured in 96-well plates. Cells were incubated with increasing concentrations of Fl-MTX, CB or AF405 in the linear phase of uptake (2.5 minutes for Fl-MTX, 10 minutes (1B1, 2B1) or 15 minutes (1B3) for CB, and 15 minutes for AF405). Transport capacity was calculated based on calibration with known amounts of the dye. Uptake in A431-OATP cells without background signal (fluorescence in A431-mock cells) is shown. Data points indicate average ± SD values obtained in three independent experiments.

