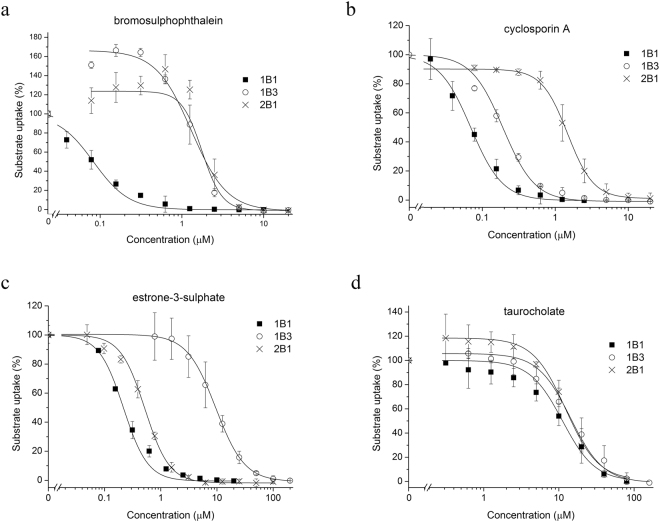
Figure 5.
Inhibition of CB and AF405 uptake in A431-OATP cells. Transport of CB (2 µM for OATP1B1 and 10 µM for OATP2B1) and AF405 (5 µM, OATP1B3) was measured for 30 minutes in the absence or presence of the investigated compounds. Transport was determined by subtracting fluorescence in A431-mock cells. Transport measured in cells with the dye alone was set to 100% and the effect of the compounds was compared to this value. Experiments were performed in triplicates with three parallels in each biological replicate. Average ± SD values are shown.

