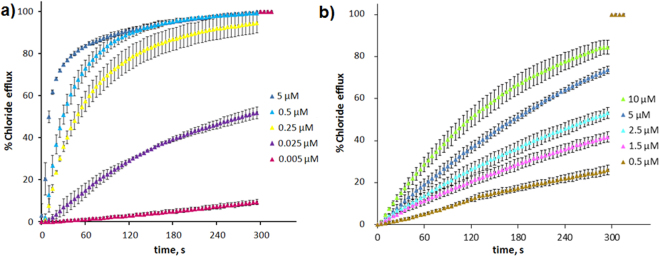
Figure 3.
Chloride efflux upon addition of 1a.HCl. (a) Time course of the normalized chloride concentration upon the application of the anion carrier at different concentrations, from 0.005 µM to 5 μM, as indicated in the figure. The LUV contained 489 mM NaCl and 5 mM phosphate buffer, pH 7.2, and were suspended in 489 mM NaNO3 and 5 mM phosphate buffer, pH 7.2. (b) The time course of the normalized chloride concentration upon the application of the anion carrier at different concentrations, from 0.5 µM to 10 μM, as indicated in the figure. The LUV contained 451 mM NaCl and 20 mM phosphate buffer, pH 7.2, and were suspended in 150 mM Na2SO4, 40 mM HCO3− and 20 mM phosphate, pH 7.2. Each trace represents the average of at least three different experiments, carried out with at least three different batches of vesicles.

