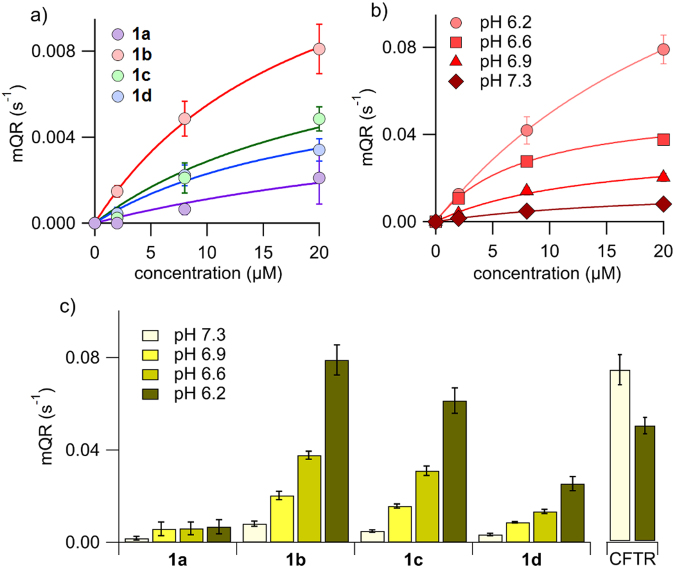
Figure 7.
Iodide influx measurements in FTR cells. (a) Dose-response relationship of compounds 1a-d. FTR-cells expressing the iodide-sensitive YFP protein were incubated in phosphate-buffered solution containing 137 mM NaCl. Iodide influx was estimated by the YFP fluorescence quenching upon addition of ICl to a final concentration of 100 mM. The maximum fluorescence quenching rate at each concentration is plotted against the carrier concentration. Each symbol is the mean of 6–10 different experiments and vertical bars are the standard error of the mean. The continuous lines are the fit of mean points to Langmuir model. (b) The activity of compound 1b was determined as function of concentration when the extracellular NaI solution was buffered at different pH values, from 7.3 to 6.2. (c) The activity of compounds 1a-d depended on extracellular pH. The figure depicted the maximum quenching rate of the four compounds at a concentration of 20 µM at the indicated extracellular pH values. Each value is the mean of 4–10 experiments. As comparison, the activity of wild type CFTR at two different extracellular pH values is shown (n = 4). CFTR was maximally activated by applying 20 µM forskolin, and a CFTR potentiator compound (10 µM genistein) before starting the fluorescence assay.

