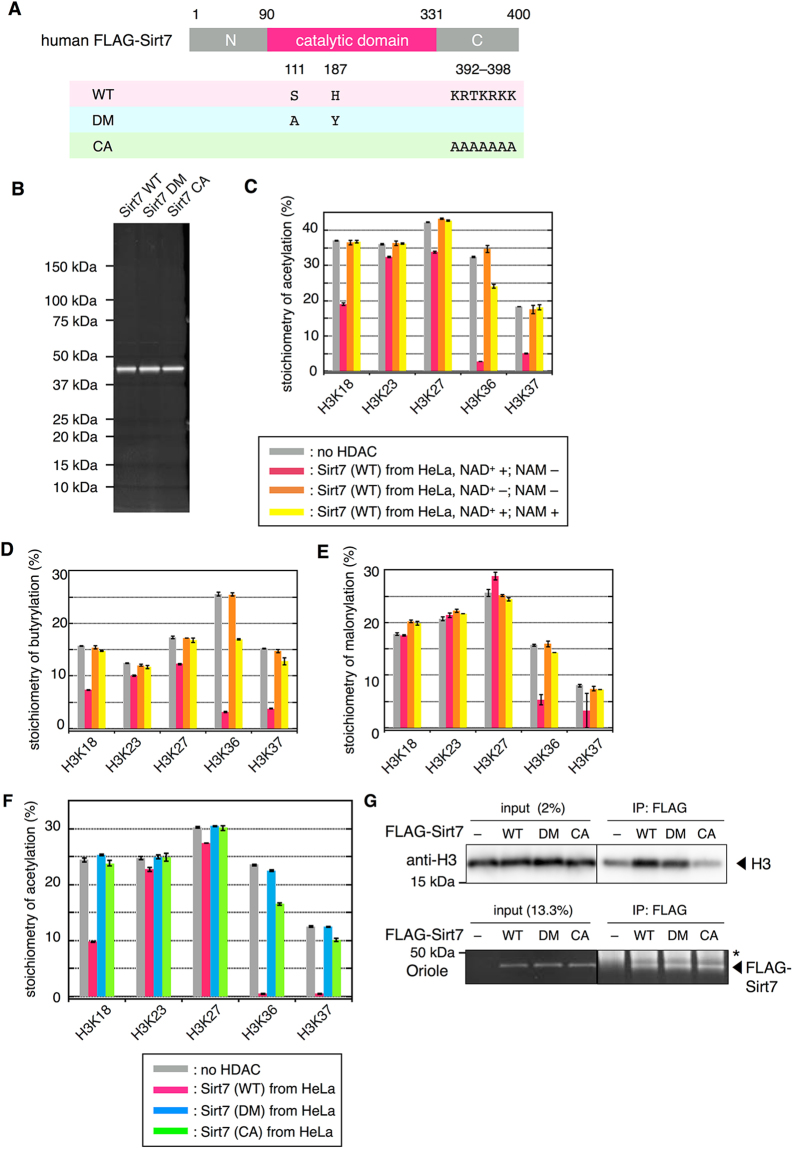
Figure 5.
Analysis of H3K36/K37 selectivity by Sirt7 using FLAG-Sirt7 mutants purified from HeLa cells. (A) Schematics showing the mutated residues in the two FLAG-Sirt7 mutants. WT: wild type; DM: double mutant (S111A/H187Y); CA: mutant where C-terminal basic region has mutated to seven alanine residues. (B) SDS-PAGE analysis of purified FLAG-Sirt7 mutants. Proteins were visualized by Oriole stain. (C) Deacetylation assay using purified FLAG-Sirt7 (WT, 2.0 ng/µL) in the presence or absence of NAD+ (2 mM) and/or NAM (10 mM). Gray: control sample; pink: Sirt7-treated sample with NAD+; orange: Sirt7-treated sample without NAD+; yellow: Sirt7-treated sample with NAD+ and NAM. Error bars indicate upper and lower limits of two independent measurements. (D) Debutyrylation assay using purified FLAG-Sirt7 (WT, 2.0 ng/µL) in the presence or absence of NAD+ (2 mM) and/or NAM (10 mM). Colors of the columns correspond to samples described in (C). Error bars indicate upper and lower limits of two independent measurements. (E) Demalonylation assay using purified FLAG-Sirt7 (WT, 3.6 ng/µL) in the presence or absence of NAD+ (2 mM) and/or NAM (10 mM). Colors of the columns correspond to samples described in (C). Error bars indicate upper and lower limits of two independent measurements. (F) Deacetylation assay using FLAG-Sirt7 mutants purified from HeLa cells (5 ng/µL). The graph shows the stoichiometry of acetylation after HDAC assay. Gray: control sample without Sirt7; pink: Sirt7 (WT)-treated sample; blue: Sirt7 (DM)-treated sample; green: Sirt7 (CA)-treated sample. Error bars indicate upper and lower limits of two independent measurements. (G) Immunoblot of recombinant nucleosomes on their own (input) or bound to beads containing the indicated FLAG-Sirt7 proteins using anti-histone H3 antibody. The bottom panel shows input or bead-bound FLAG-Sirt7 stained with Oriole. Asterisk indicates heavy chains of anti-FLAG antibody. The grouping of images from different parts of the same gel is indicated by dividing lines. Uncropped images of (B) and (G) are shown in Fig. S6.

