Figure 1.
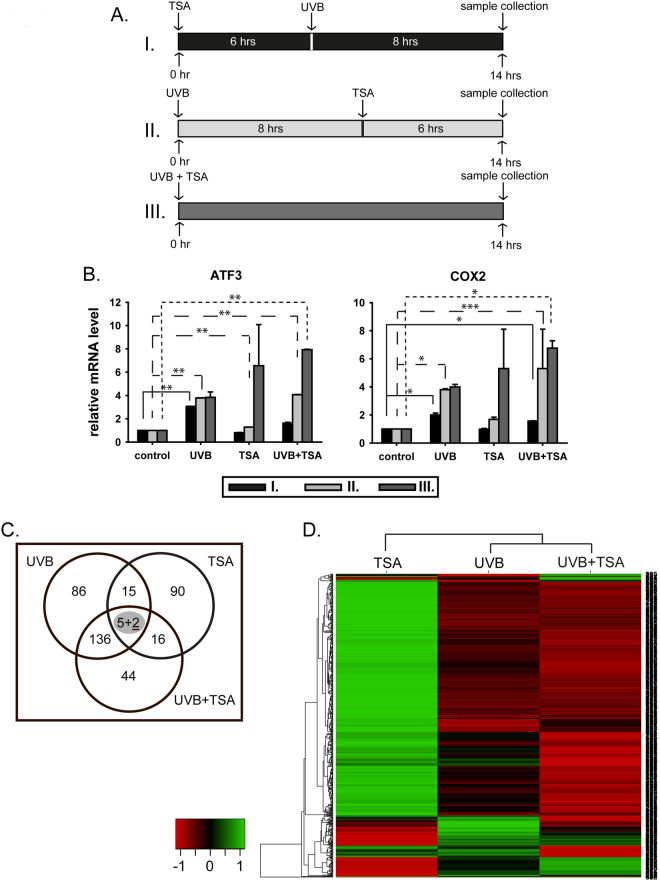
UVB-induced expression level of ATF3 and COX2 influenced by TSA. HKerE6SFM cells were treated with high doses of UVB and HDAC inhibitor TSA in different combinations. (A) Treatment combinations are illustrated in panel A, rows I, II and III. (B) The mRNAs were isolated 14 hours after the first treatment and the expression levels of ATF3 and COX2 were analysed by qPCR. The means and standard deviations of five independent experimental triplicates are indicated as fold-expression compared to the control. Standard deviations and statistical significances are shown. Star indicates statistical significance between the dataset (paired Anova *P < 0.05, **P < 0.01, ***P < 0.001, ****P < 0.0001). Legends for the X-axis are control (no treatment), UVB (only UVB no TSA), TSA (only TSA no UVB) and UVB + TSA (both UVB and TSA). Graph legends (I, II and III.) correspond to UVB and TSA treatment indicated in Panel A. (C) Plot of genes differentially expressed in HKerE6SFM cells upon UVB, TSA or UVB + TSA combined treatment in microarray experiments. Circles represent groups of genes modified by UVB, TSA and UVB + TSA treatments compared to the control, respectively. Numbers indicate the number of genes showing altered mRNA levels by one or more stimuli. Underlined, bold number: superinduced genes in UVB + TSA samples (compared to UVB treated samples). (D) Heatmap representation of differential gene expression following UVB and TSA treatment. Only genes displaying alterations upon one or the other treatment are included in the map. Red and green colour indicates down- and upregulation, respectively. Expression changes are shown in a log2 scale.

