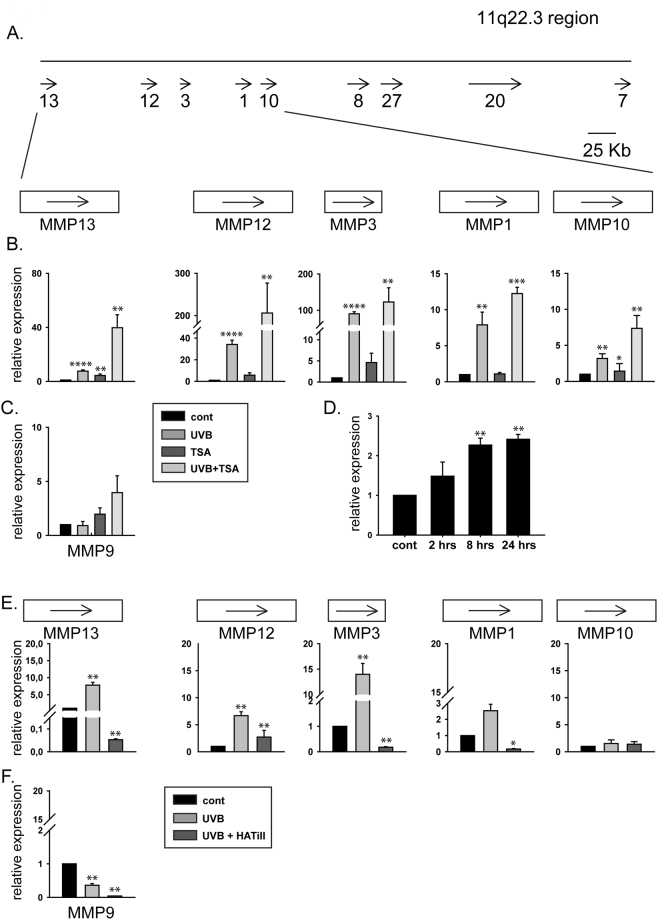
Figure 2.
Differential expression of MMP genes located in the 11q22.3 region and MMP9. (A) Schematic drawing of the MMP gene cluster localized at chromosome 11q22.3 based on the NCBI GeneBank database. Arrows represent genes and the orientation of their transcription. Numbers indicate the corresponding MMP genes (e.g., 13 is MMP13). The drawing represents only the negative strand of the region. (B and C) Expression levels of MMP genes in human keratinocyte cells. HKerE6SFM cells were treated with UVB, TSA or UVB + TSA. The mRNAs were isolated 14 hours after the first treatment, and the expression levels of MMP13, MMP12, MMP3, MMP1, MMP10 (B) and MMP9 (C) were analysed by qPCR. The means and standard deviations of six independent experimental triplicates are indicated as fold-expression compared to the control. Star indicates statistical significance between the dataset (paired Anova *P < 0.05, **P < 0.01, ***P < 0.001, ****P < 0.0001). Legends for the X-axis are control (no treatment), UVB (only UVB no TSA), TSA (only TSA no UVB) and UVB + TSA (both UVB and TSA). (D) Pre-mRNA levels of MMP3. HKerE6SFM cells were treated with 80 mJ/cm2 UVB. The mRNAs were isolated 2, 8 and 24 hours after the first treatment, and pre-mRNA levels of MMP3 were analysed by qPCR. The means and standard deviations of five independent experimental samples are indicated as fold-expression compared to the control. Star indicates statistical significance between the dataset (paired Anova P values as indicated above).

