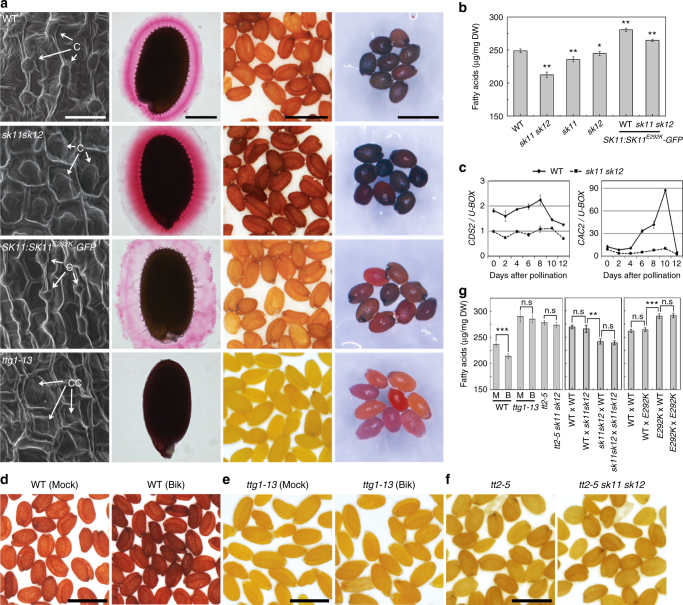
Fig. 3.
Altered activity of SKs affect seed characters. a Examination of seed coat phenotypes of mature Arabidopsis seeds in various genetic backgrounds. Scanning electron microscopy (SEM) of seed coat (first column), seed coat mucilage staining with ruthenium red (second column), seed color (third column), and seed staining with p-dimethylaminocinnamaldehyde (DMACA) (fourth column) are shown in panels from left to right. Scale bars, 25 μm, 200 μm, 1 mm, and 1 mm (from left to right). In SEM panels, “C” indicates columella, while “CC” indicates collapsed columella. b Measurement of total fatty acid contents of mature seeds in various genetic backgrounds. Values are mean ± s.d. of three biological replicates. Asterisks indicate significant differences between wild-type and samples in other genetic backgrounds (two-tailed paired Student’s t test, *P < 0.05, ***P < 0.001). c Quantitative real-time PCR analysis of CDS2 and CAC2 expression in developing seeds of wild-type and sk11 sk12 plants. Results were normalized against the expression levels of U-BOX as an internal control. Values are mean ± s.d. of three biological replicates. d, e Effect of bikinin treatment on seed color of wild-type (d) and ttg1-13 (e) mature seeds. Wild-type and ttg1-13 siliques were mock-treated (Mock) or treated with 25 μM bikinin (Bik) at 4 days after pollination, and the resulting mature seeds were collected for further analyses. Scale bars, 1 mm. f Comparison of seed color of tt2-5 and tt2-5 sk11 sk12. Scale bar, 1 mm. g Measurement of total fatty acid contents of mature seeds described in d–f (left panel) and mature F1 seeds from reciprocal crosses between wild-type and sk11 sk12 plants (middle panel) or between wild-type and SK11:SK11E292K-GFP (E292K) plants (right panel). Values are mean ± s.d. of three biological replicates. Asterisks indicate significant differences between each specified pair of samples in different genetic backgrounds (two-tailed paired Student’s t test, **P < 0.01, ***P < 0.001, no statistical difference (n.s), P > 0.05). M, mock-treated; B, bikinin-treated

