Fig. 5.
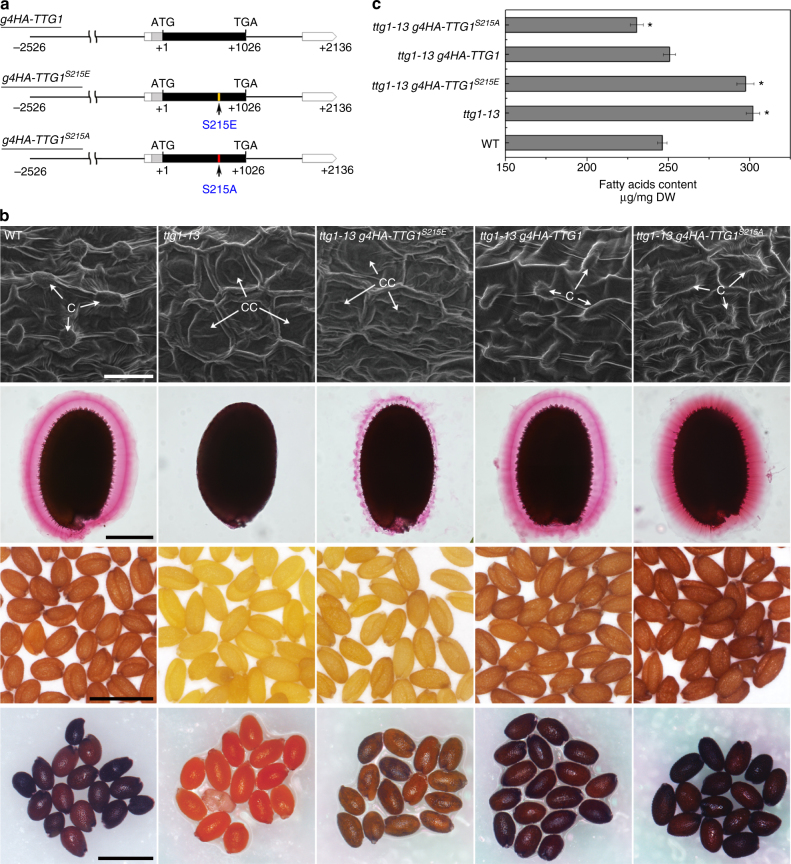
Phosphorylation of TTG1 at Ser 215 abolishes its activity in regulating seed characters. a Schematic diagram of the phosphorylation-mimicking construct g4HA-TTG1S215E and the dephosphorylation-mimicking construct g4HA-TTG1S215A. The coding and untranslated regions of TTG1 are indicated by black and white boxes, respectively, while an intron and other genomic regions are indicated by black lines. The 4HA tag represented by a gray box is fused to the N terminus of TTG1. The first nucleotide of the translation start codon is assigned the +1 position, and other sequences are numbered relative to this site. Arrow indicates the site containing a point mutation from S to E or S to A at Ser 215. b Examination of seed coat phenotypes of mature Arabidopsis seeds in various genetic backgrounds. SEM of seed coat (first row), seed coat mucilage staining with ruthenium red (second row), seed color (third row), and seed staining with DMACA (fourth row) are shown in panels from top to bottom. Scale bars, 25 μm, 200 μm, 1 mm, and 1 mm (from top to bottom). In SEM panels, “C” indicates columella, while “CC” indicates collapsed columella. c Measurement of total fatty acid contents of mature seeds in various genetic backgrounds. Values are mean ± s.d. of three biological replicates. Asterisks indicate significant differences between wild-type and samples in other genetic backgrounds (two-tailed paired Student’s t test, P < 0.001)

