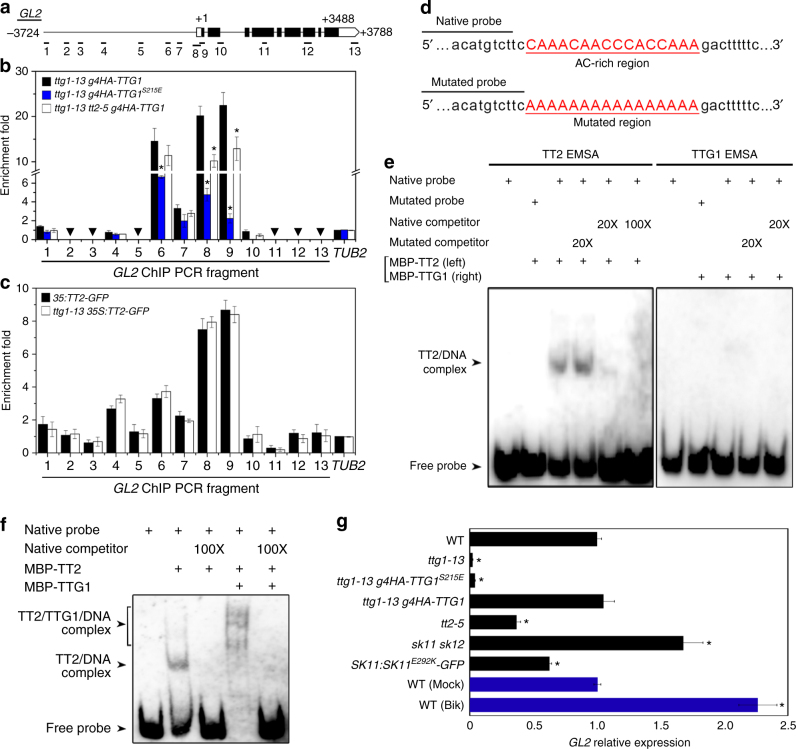
Fig. 7.
Phosphorylation of TTG1 at Ser 215 weakens TTG1 binding to the GL2 locus through TT2. a Schematic diagram of the GL2 genomic region. The coding and untranslated regions are indicated by black and white boxes, respectively, while introns and other genomic regions are indicated by black lines. The first nucleotide of the translation start codon is assigned the +1 position, and other sequences are numbered relative to this site. Thirteen DNA fragments (1–13) spanning the GL2 locus were designed for ChIP analyses as shown in b, c. b, c ChIP analyses of binding of 4HA-TTG1 variants (b) and TT2-GFP (c) to the GL2 locus. Chromatin immunoprecipitation analyses were performed on siliques in various genetic backgrounds 4 days after pollination. Nuclear extracts served as the input, while immunoprecipitated fractions by anti-HA antibody (b) and anti-GFP antibody (c) were used as the eluate. A TUB2 fragment was amplified as a negative control. Triangles indicate barely detectable amplicons at certain sites. Values are mean ± s.d. of three biological replicates. Asterisks indicate significant differences in enrichment fold changes in comparison with ttg1-13 g4HA-TTG1 (two-tailed paired Student’s t test, P < 0.001). d List of the putative TT2-binding element (native probe) near primer 9 in the GL2 genomic region shown in a, and its mutated version (mutated probe). The mutated AC-rich region is underlined in red. These probes were used for subsequent EMSA assays. e, f EMSA assays of binding of MBP-TT2 (e, left panel), MBP-TTG1 (e, right panel), and both proteins (f) to the probes shown in c. Recombinant proteins were incubated with biotinylated native or mutated probe. Nonlabeled native or mutated probes in 20- or 100-fold molar excess relative to the biotinylated native probe were used as cold competitors. Supershift complexes were observable (f) when MBP-TT2 and MBP-TTG1 were incubated with the biotinylated native probe. g Quantitative real-time PCR analysis of GL2 expression in siliques in various genetic backgrounds 4 days after pollination. Wild-type siliques mock-treated (Mock) or treated with 25 μM bikinin (Bik) for 2 h were collected for expression analysis shown in blue bars. Expression values normalized against the expression levels of U-BOX are shown relative to the level in wild-type siliques set as 1. Values are mean ± s.d. of three biological replicates. Asterisks indicate significant differences in GL2 expression between indicated genotypes and wild-type plants (black bars) or between bikinin- or mock-treated wild-type plants (blue bars) (two-tailed paired Student’s t test, P < 0.001). Uncropped original scans of immunoblots are shown in Supplementary Fig. 17

