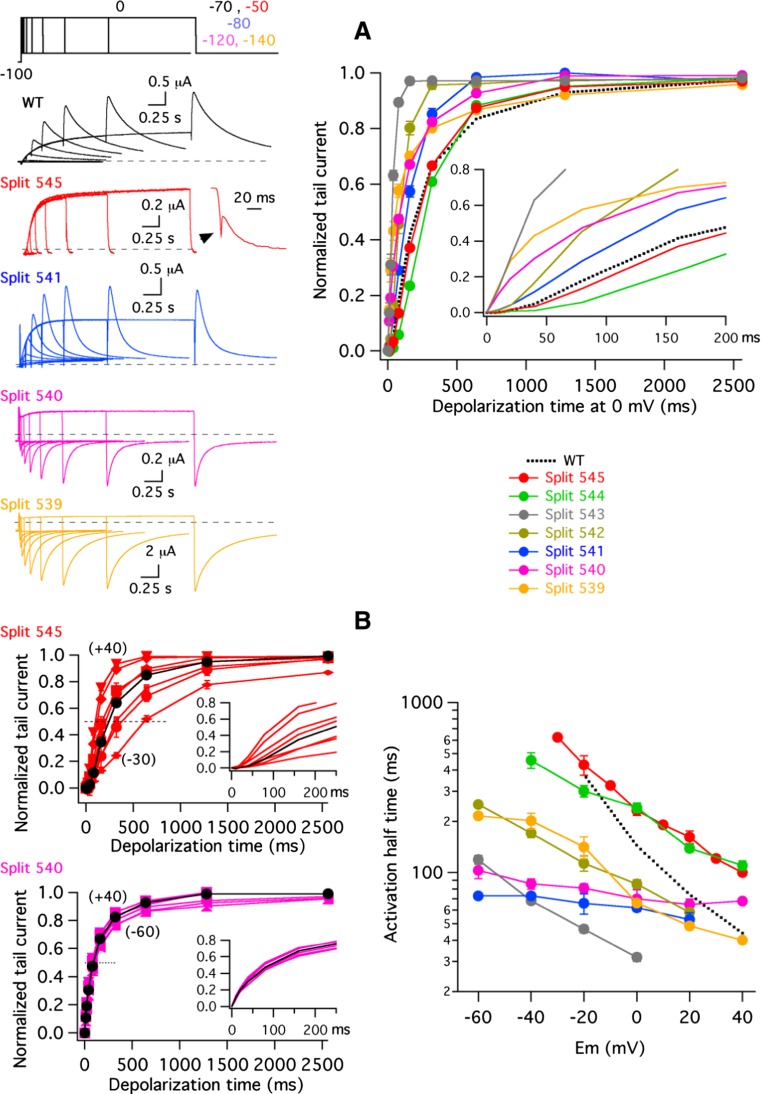
Fig. 2.
Effect of split position displacement on Kv11.1 split voltage-dependent activation rates. a Comparison of time course of current activation at 0 mV. Families of representative membrane currents from individual oocytes (left). The duration of a depolarizing prepulse to 0 mV was varied as illustrated in the envelope-of-tail currents protocol at the top, illustrative of that used with WT channels, followed by a repolarization step to the indicated potentials (− 70, − 50, − 80, − 120 and − 140 mV for WT, split 545, split 541, split 540 and split 539 variants, respectively). Cells expressing split 539 and split 540 channels were held at − 140 and − 120 mV trying to ensure that they also start in deactivated state. An enhanced view of the very rapidly deactivating split 545 tail current at the end of the 2560-ms depolarizing step is shown in the inset. Averaged plots of normalized tail current magnitudes versus depolarization time at 0 mV (right). Values from continuous wild-type channels are shown as a dotted line for comparison. An expansion of the initial 200 ms to highlight the progressive disappearance of the early current delay in the sigmoidal activation time course is shown in the inset. b Comparison of activation rate voltage dependence. Plots of normalized tail current magnitudes versus depolarization times at voltages between − 30 and + 40 mV (split 545) or − 60 and + 40 mV (split 540) at 10 and 20 mV intervals were generated from current traces as indicated in a (left). These plots were used to measure times necessary to attain half-maximum current magnitudes (dotted lines). Expanded views of the initial 250 ms of the plots are shown in the insets. Data obtained at 0 mV are represented in black. Dependence of activation rates on depolarization membrane potentials (right). The time necessary to attain half-maximum tail current magnitude is plotted versus depolarization potential. Values from continuous wild-type channels are shown as a dotted line for comparison

