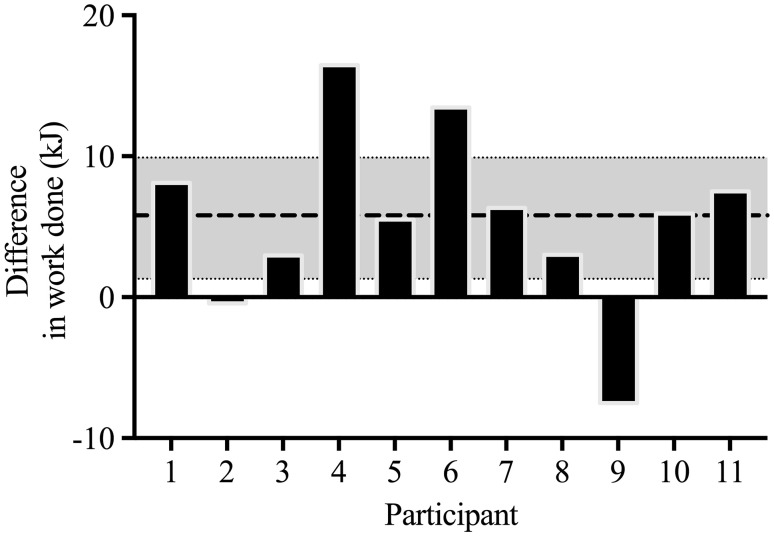
Fig. 2.
Difference in work complete between NaHCO3 treatment against placebo treatment for all participants. Values greater than zero indicate that a greater volume of work was performed with NaHCO3 and values lower than zero indicate that less work was performed with NaHCO3 compared to placebo. Dashed line represents mean difference in work complete and the shaded band shows the ± 95% CI of effect between treatments

