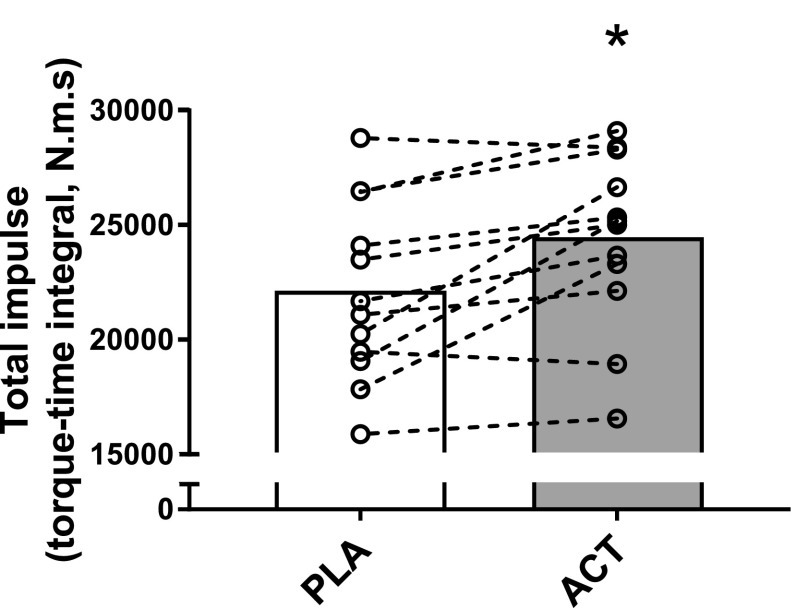
Fig. 3.
Group mean total impulse values in the placebo (PL) and acetaminophen (ACT) conditions are shown in the open and closed bars, respectively. Individual responses in the PLA and ACT conditions are shown by the open circles and linked with dashed lines. *Significantly different from PLA (P < 0.05)

