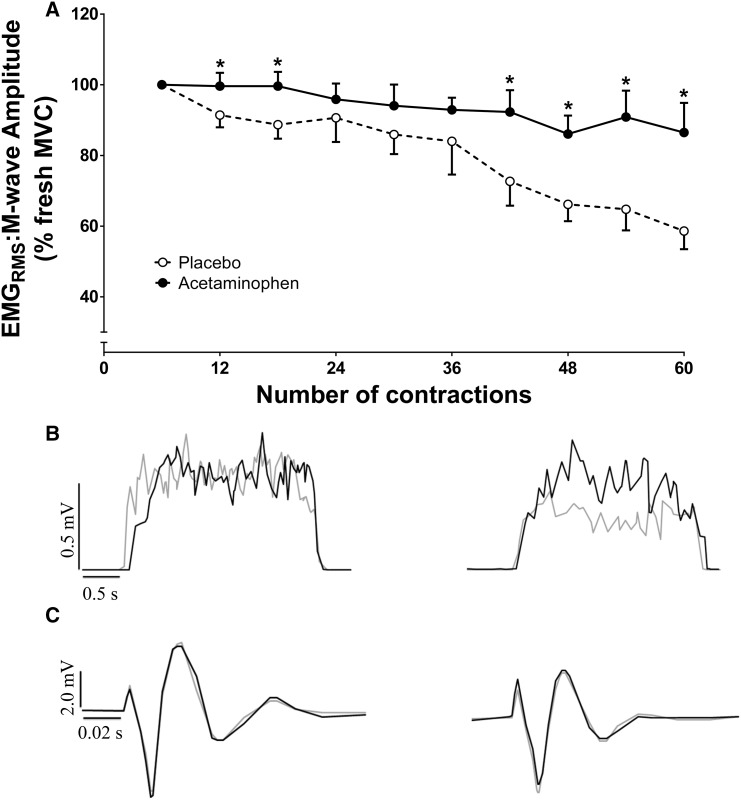
Fig. 5.
Surface electromyography (EMG) responses (expressed relative to M-wave amplitude) during the 60 MVC test for placebo (clear circles) and acetaminophen (filled circles) trials. Mean ± SE EMG responses are presented in a with the EMG response from a representative individual presented in b, for the 5th and 55th contractions, respectively, for PL (grey line) and ACT (black line). Individual representative data for M-wave can be seen in panel C for the 6th and 54th contractions, respectively, for PL (grey line) and ACT (black line). *Significantly different from placebo (P < 0.05)

