
Fig. 1.
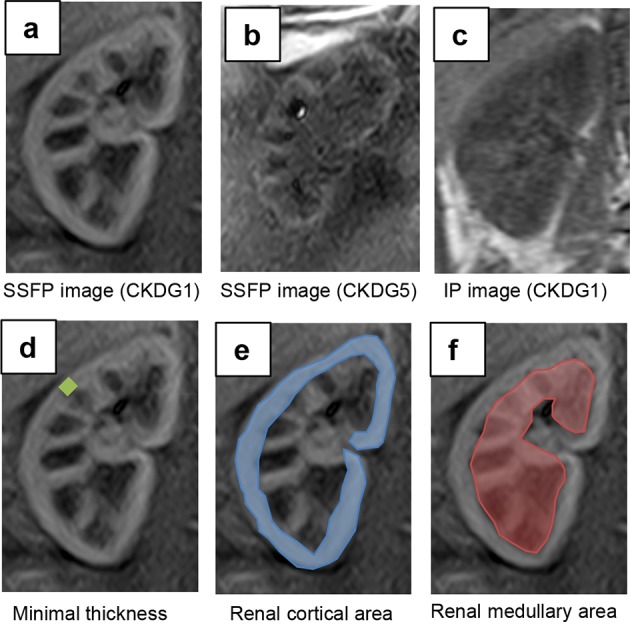
Representative coronal kidney images of noncontrast-enhanced steady-state free precession (SSFP) magnetic resonance imaging (MRI) with spatially selective inversion recovery pulse at 1.5-T unit (a, b, d–f) or conventional in-phase MRI at 3.0-T unit (c). a An SSFP image of a CKD G1 patient. b An SSFP image of a CKD G5 patient. c A conventional in-phase image of a CKD G1 patient. Minimal cortical thickness, cortical area, and medullary area are shown as a yellow band (d), blue area (e), and red area (f), respectively