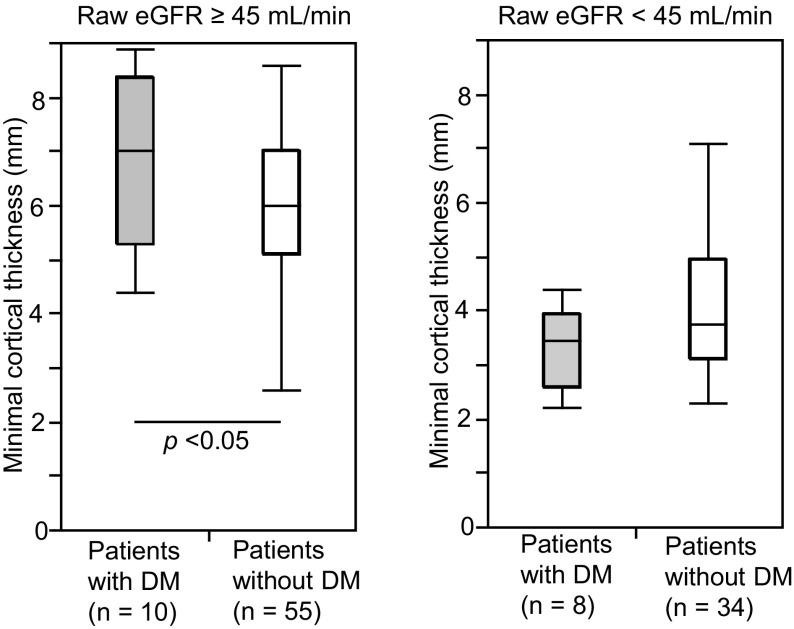
Fig. 8.
Comparison of minimal cortical thickness between patients with chronic kidney disease (CKD) with or without diabetes mellitus (DM). The patients with CKD were divided into two groups, those with a raw estimated glomerular filtration rate (eGFR) ≥ 45 mL/min and those with a raw eGFR < 45 mL/min, and minimal cortical thicknesses were compared between patients with CKD and DM and those with CKD but without DM. Values are shown as mean ± SD

