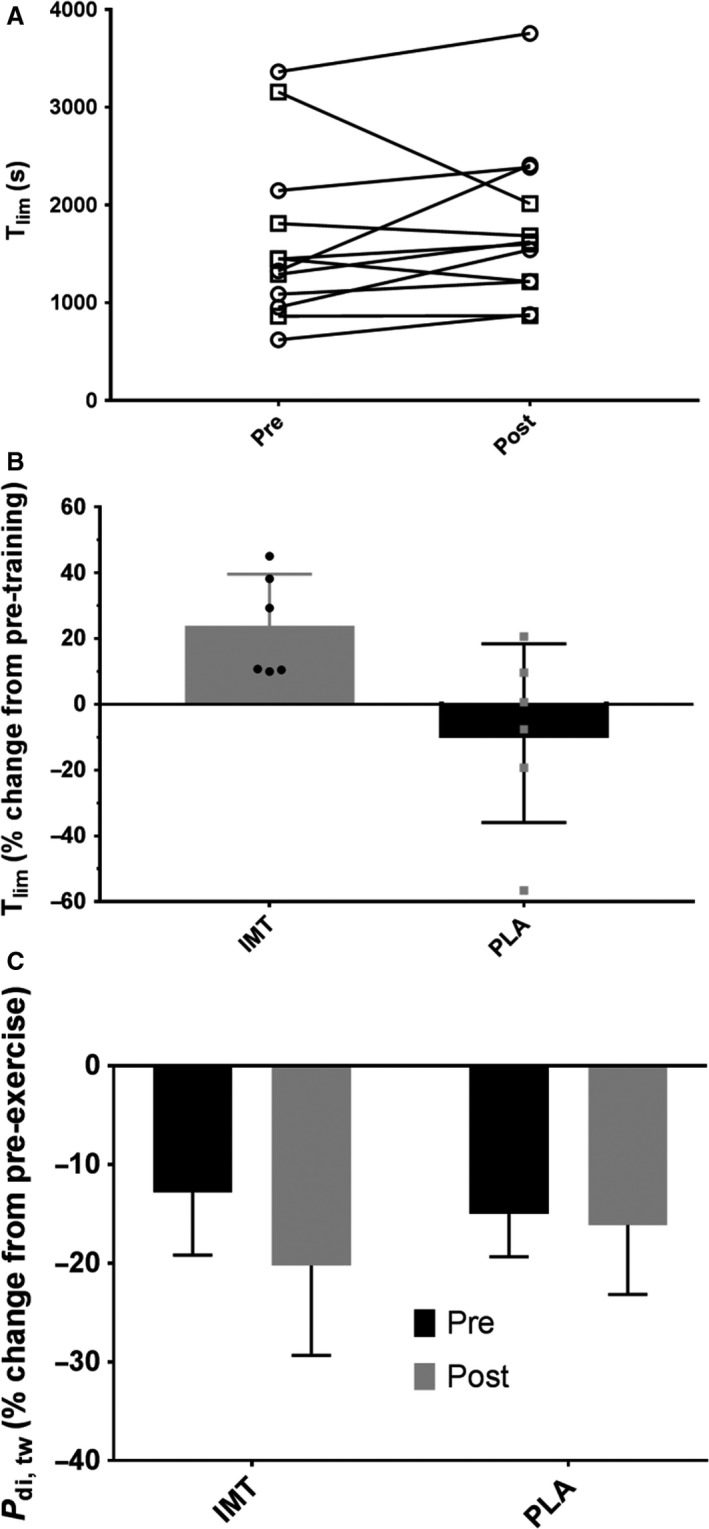
Figure 2.

Pre‐ and Posttraining T lim for each group (open circles, IMT, open squares PLA). T lim (Panel B) and P di, tw (Panel C) data from pre‐ to postIMT. *significantly different from pre‐ to posttraining. T lim in the IMT group improved significantly more (median change 20.0%, range +9.9 to +45%; P = 0.046, 95% CI +3.7 to +65.1%) compared to the PLA group (median change −3.5%, range −56.6 to +20.6%).
