Figure 2.
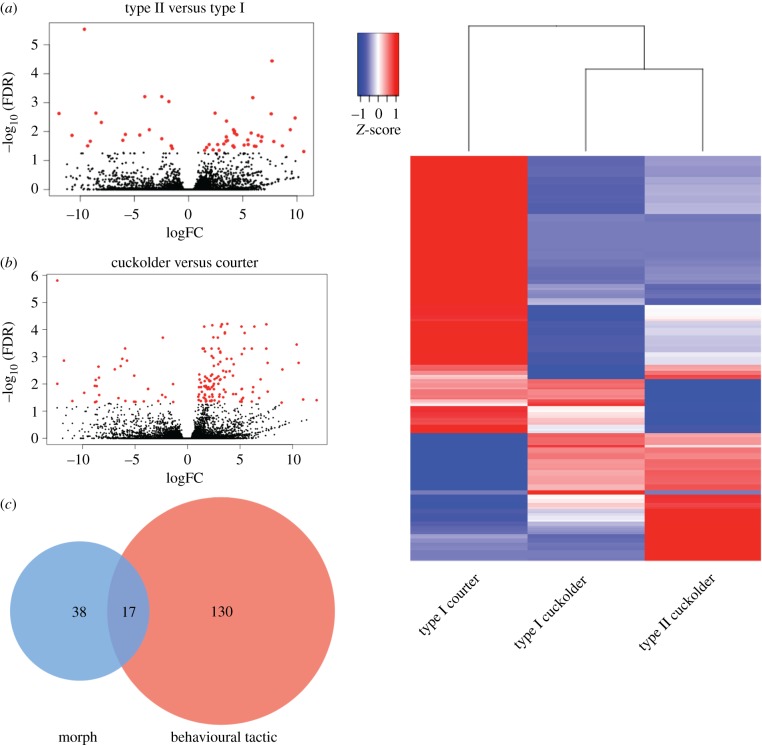
Differential expression trends. (a) Volcano plot showing differentially expressed (DE) transcripts across morph. Transcripts on the left are upregulated in type II and those on the right in type I males. (b) Volcano plot of DE transcripts across behavioural tactic. Transcripts on the left are upregulated in cuckolding males, those on the right are upregulated in courting males. Each transcript is represented by a dot; red dots indicate DE transcripts (FDR < 0.05). (c) Venn diagram showing number of transcripts DE in comparisons of morph (blue), behavioural tactic (red) or both (purple). (d) Heatmap of DE transcripts clustered by morph/behaviour group.

