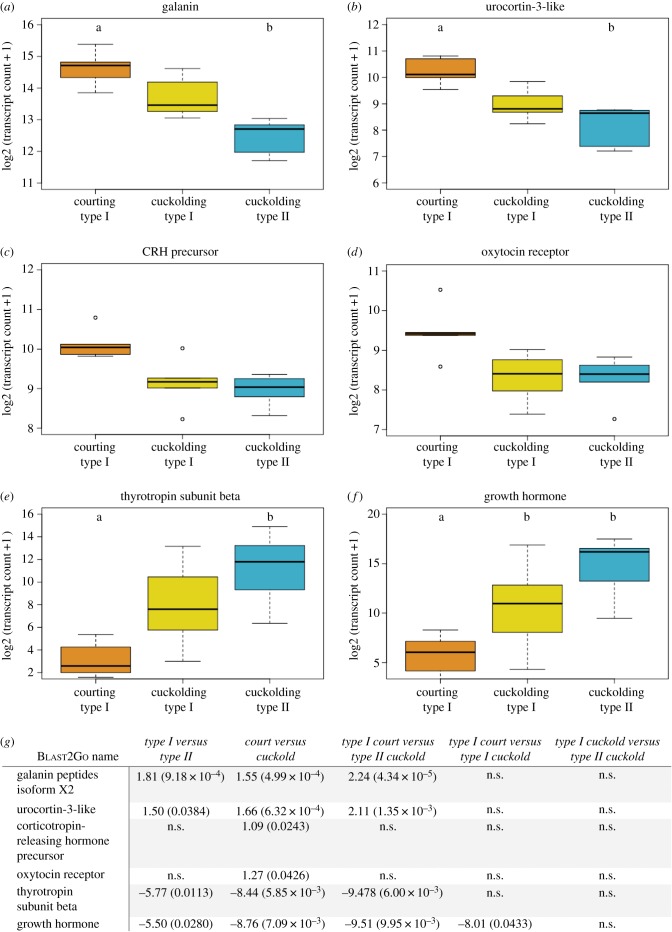
Figure 3.
Differentially expressed transcripts of functional interest (n = 5 animals per group). Boxplots showing expression levels of (a) galanin, (b) urocortin-3-like, (c) corticotropin-releasing hormone precursor, (d) oxytocin receptor, (e) thyrotropin subunit beta and (f) growth hormone. Expression displayed as log2 of transcript count estimate +1. Median, maximum and minimum values are indicated. Open circles represent outliers. Letters indicate significant differences between groups. Courting males significantly different from all cuckolding males in (c) and (d); see (g) for statistics. (g) Statistics for all comparisons of transcripts annotated by ‘hormone activity’, ‘oxytocin receptor activity’ or ‘vasopressin receptor activity’. Values are log2FC (FDR), ns, not significant. (Online version in colour.)

