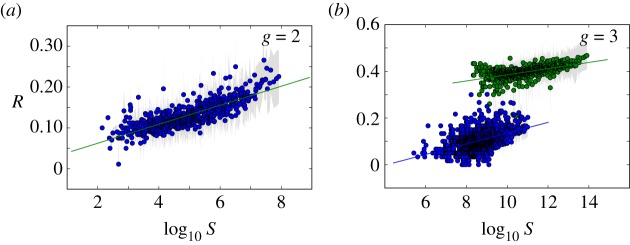
Figure 3.
Phenotypic robustness is linearly related to the logarithm of phenotype abundance. For g = 2 and g = 3, we sampled 107 genotypes and computed their robustness. Then we assigned each of them to their corresponding phenotypes, and estimated phenotypic robustness, the average robustness for all genotypes encoding a given phenotype (see text). (a) Phenotypic robustness in g = 2 versus the logarithm of phenotype abundance. The line represents the power-law relationship Rp = 1.037 S0.0232. (b) For g = 3, we separated those phenotypes belonging to  (green circles, above) from the rest (blue circles, below). Both sets show a power law relationship between phenotypic robustness and phenotypic abundance: Rp = 1.790 S0.0133 for phenotypes in
  (green line) and Rp = 0.805 S0.0233 for the remaining 25 717 phenotypes (straight lines). Grey area encompasses two standard deviations, and the fits were obtained using the least-squares method. (Online version in colour.)

