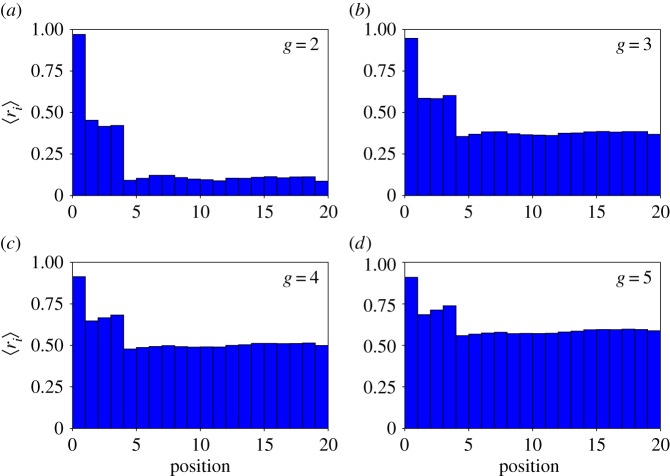
Figure 4.
Different positions in the genome have different neutralities. We sampled 107 genotypes for g = 2 (a) and g = 3 (b) and 103 genotypes for g = 4 (c) and g = 5 (d), and measured ri for i = 1, …, 20. For each i we then computed 〈ri〉 and plotted them versus genomic position. Note the high robustness of the first position in the promoter region, and the low robustness in the coding regions. (Online version in colour.)

