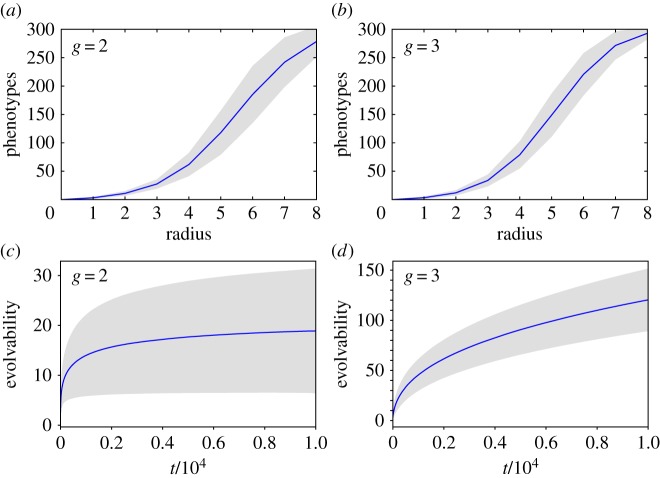
Figure 5.
Evolvability in toyLIFE. A genotype–phenotype map has the shape space covering property if, given a phenotype, we only need to explore a small radius around a sequence encoding that phenotype in order to find the most common phenotypes. We tested this property in toyLIFE by sampling 100 genotypes for g = 2 (a) and g = 3 (b), and counting how many of the 300 most common phenotypes appeared in a radius of distance 8 around a given genotype. The results are consistent with shape space covering. For g = 2 (c) and g = 3 (d), we also measured the cumulative number of phenotypes in the neighbourhood of a neutral random walk—evolvability—for 10 000 genotypes. Evolvability is much higher for g = 3. Lines show average values, while grey areas encompass two standard deviations. (Online version in colour.)

