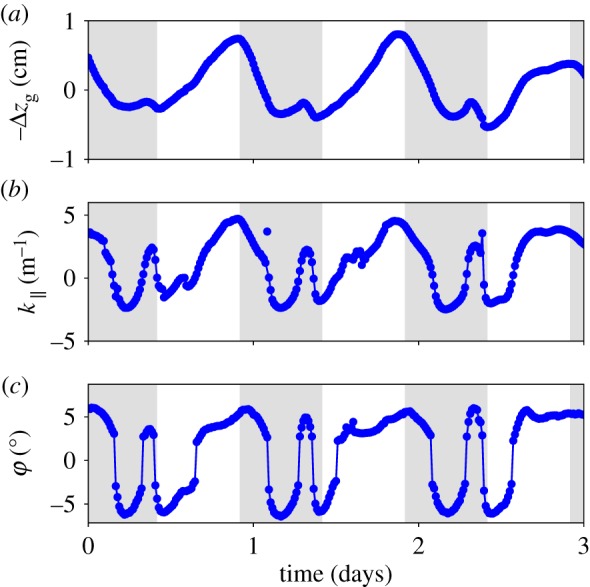
Figure 3.

Sample of experimental data for a given point on the midrib located in the middle of the expansion region. The evolution of the mean vertical position (a), midrib curvature (b) and folding angle (c) as a function of time, for 3 days. The grey areas correspond to night-time. (Online version in colour.)
