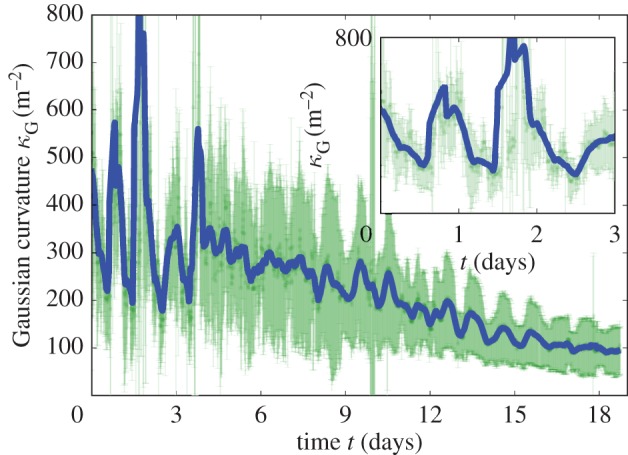
Figure 5.

Gaussian curvature of the lamina as a function of time. Curvature has been computed for vertices all over the leaf by considering the two parts of the lamina separately in order to exclude the folding angle in the computation. The error bars in light green represent their standard deviation, while a smoothed mean is represented by the thick blue line (for raw data, see the electronic supplementary material, figure S19). The inset shows a zoom over the first three days corresponding to figure 3. (Online version in colour.)
