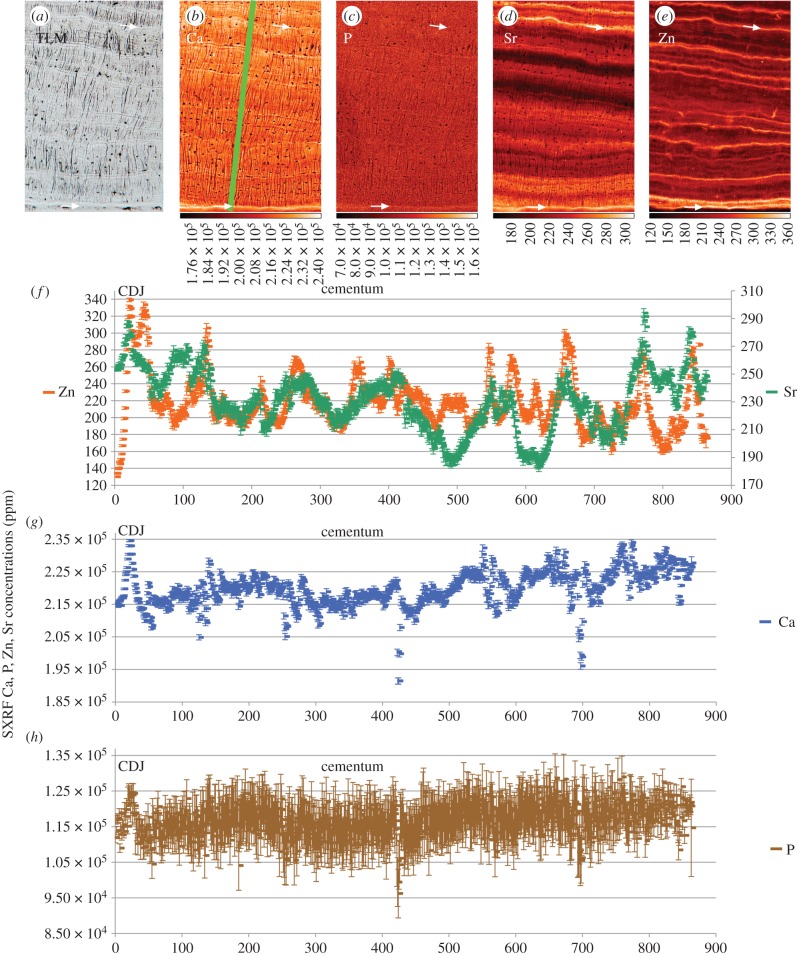
Figure 5.
SXRF scans (1 µm) of Ca, P, Sr and Zn in regular compensatory cellular cementum in the lower incisor root of Pan (UCL-CA-14E) with the corresponding TLM on the left. The lower white arrows denote the first-formed bright (dense) cementum layer at the CDJ. The upper white arrow denotes another clear bright marking in the TLM. The green bar (860 µm long) on the Ca map indicates the plane of SXRF Zn, Sr and Ca, P concentrations (ppm) plots. There is poor correspondence between Zn and Sr levels. Colour scales beneath each image denote concentration (ppm).

