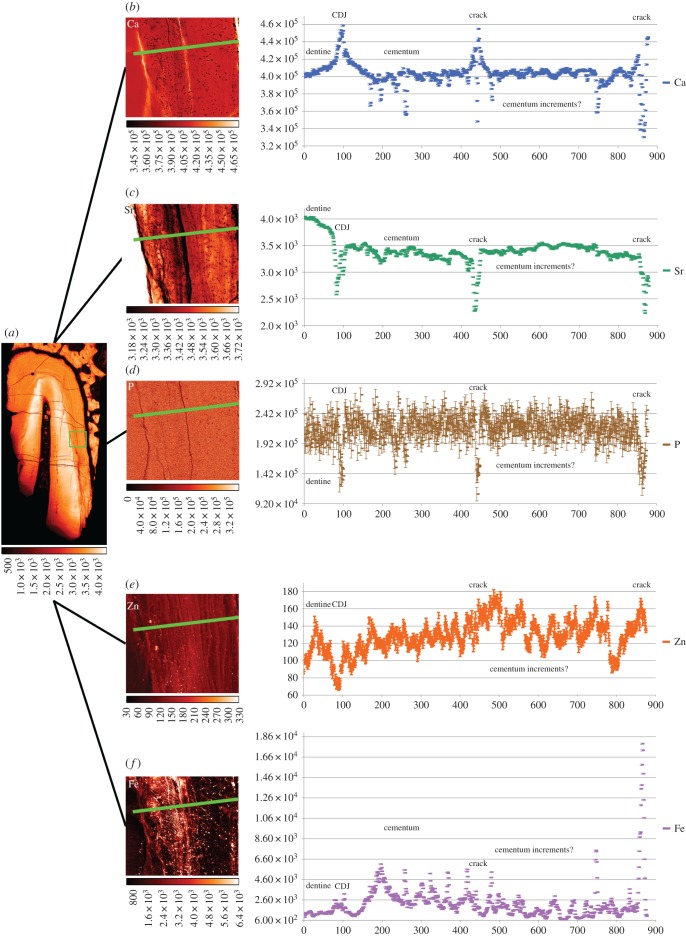
Figure 9.
SXRF map of Sr in KNM-ER 1817 at 15 µm resolution (a) with green boundary box representing the location of SXRF maps of Ca (b), Sr (c), P (d), Zn (e) and Fe (f) at 1 µm resolution. Plots show Ca and Fe levels rise in the calcite containing cracks, but P, Sr and Zn levels in cracks fall to very low levels. Fluctuations in Ca, P and Sr levels may correspond with cementum increments visible in the transmitted light micrograph (figure 6a). Colour scales beneath each image denote concentration (ppm).

