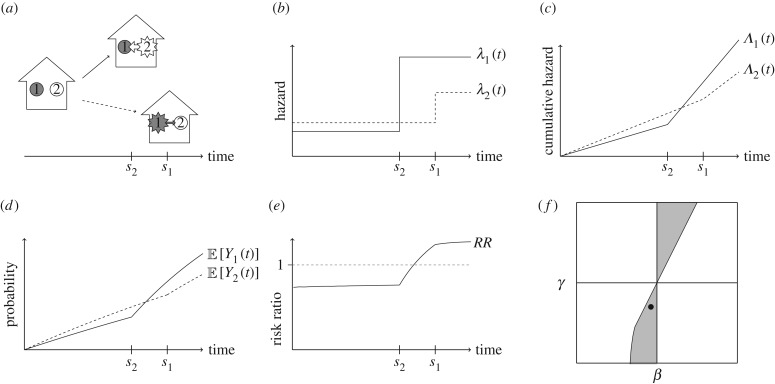
Figure 2.
Illustration of how the risk ratio can give misleading results under contagion in a cluster of size two. Suppose the conditions of result 3.4 hold with β < 0 and γ < 0 (such that the presence of the covariate, designated as value = 1, is associated with reduced susceptibility and transmissibility). Subject 1 (grey) has x1 = 1, subject 2 (white) has x2 = 0. (a) Either subject 2 becomes infected first (at time s2), or subject 1 is infected first (at time s1); depending on which is infected first, the other experiences a change in their hazard of infection. (b) If 1 is infected first, then 2 experiences only a small increase in hazard, because γ < 0. Alternatively, if 2 is infected first, then 1 experiences a large increase in hazard because x2 = 0. (c) The relationship between the cumulative hazards in these scenarios, and hence the relationship between the expected infection outcomes (d), is eventually reversed at some time after s2. Therefore, the risk ratio (e) eventually rises above one. Panel (f) shows the region of (β, γ) parameter space in which bias across the null may occur, where β and γ are plotted on the same scale. A black dot indicates the values of β and γ used in this illustration.

