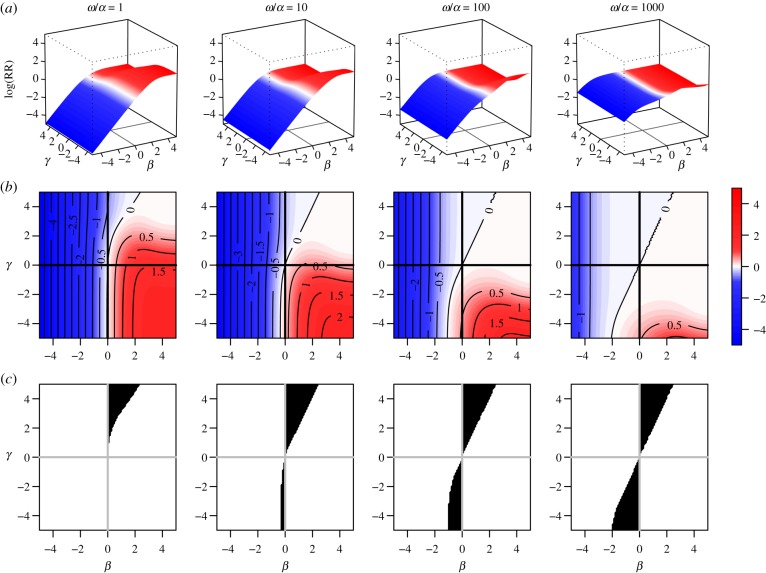
Figure 3.
Risk ratio (log) as a function of true covariate effects β and γ. Row (a) shows the log risk ratio surface on (β, γ) space, and (b) shows the corresponding heat maps and contours for the log risk ratio. Row (c) shows the region of (β, γ) space in which the risk ratio is biased across the null hypothesis of β = 0. In the absence of bias, contour lines would be perfectly vertical and would match the value of β. In the absence of direction bias, heat maps for log[RR] would be entirely blue to the left of the β = 0 line, and red to the right of it. The greater the mismatch between β and the corresponding log[RR] contour line, the greater the bias. The bottom row shows the region of bias across the null, in which log[RR] and β have different signs. Study setup: clusters of size two with exactly one subject per cluster with x = 1. Values of the ω/α summarize the relative contribution of within-cluster transmission compared to transmission from the community. Observation time T was chosen such that cumulative incidence when β = 0 and γ = 0 is approximately 0.15 in all of the plots.

