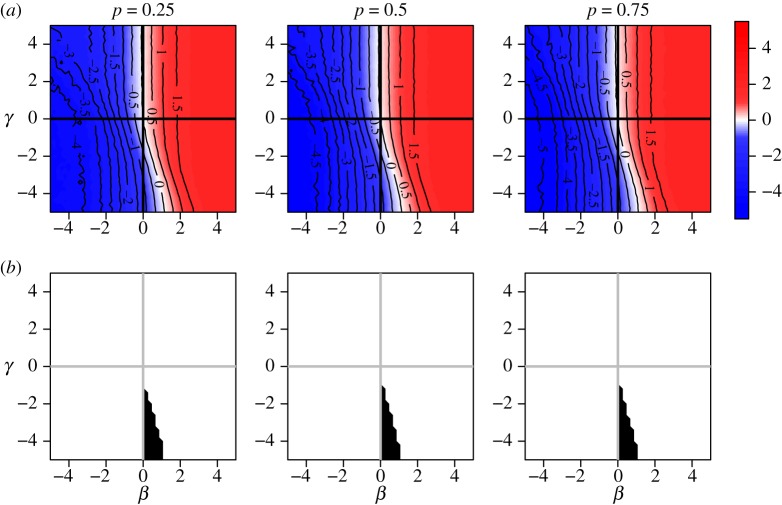
Figure 5.
Risk ratio (log) and region of bias across the null as a function of true covariate effects β and γ when cluster size is constant and x is cluster randomized: proportion p of clusters have  , and remaining 1 − p have
  . Row (a) shows the value of log[RR], and (b) shows the region of bias across the null. In all plots α = 0.0001, ω = 0.01, N = 500, ni = 4, Ti = 450 and no subjects are infected at time zero.

