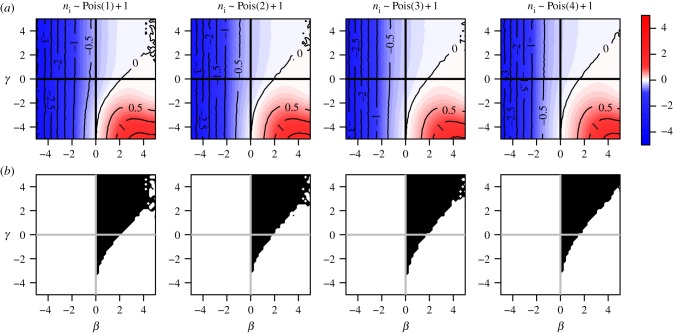
Figure 6.
Risk ratio (log) and region of bias across the null as a function of true covariate effects β and γ when cluster size ni ∼ Pois(μ) + 1 and x is block randomized such that  for all i. Row (a) shows log[RR], and (b) shows the region of bias across the null. In all plots α = 0.0001, ω = 0.01, N = 500, no subjects are infected at time zero and observation time Ti is chosen such that cumulative incidence when β = 0 and γ = 0 is approximately 0.15.

