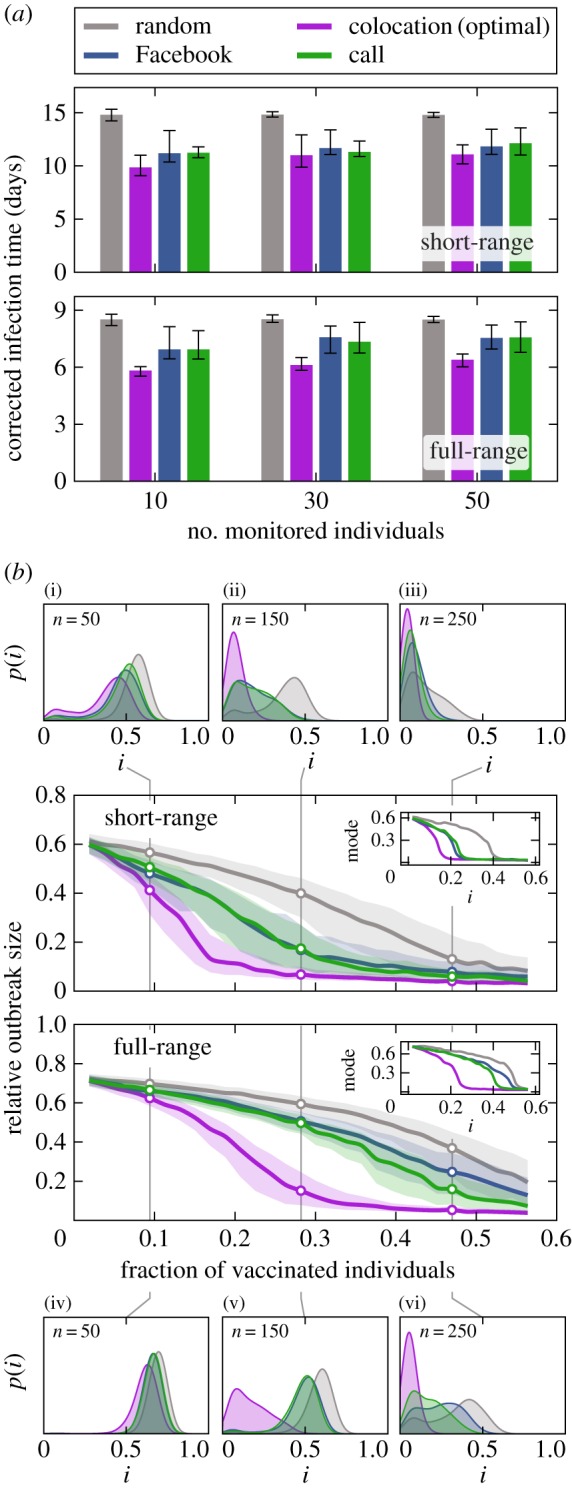
Figure 2.

Vaccination effectiveness and outbreak dynamics. (a) Median corrected time of infection among members of the social target groups compared to random (grey) and optimal (purple) groups. Error bands denote lower and upper quartiles. (b) Relative outbreak size under different immunization strategies for diseases with short-range (top) and full-range (bottom) transmission. Error bands mark the lower and upper quartiles. Insets show the mode of the distributions over all realizations. Outbreak size distributions p(i) are shown for target groups of 50, 150 and 250 individuals; in the case of short range in subfigures (i)–(iii) and for full range in subfigures (iv)–(vi). The size of the target groups is indicated for each distribution.
