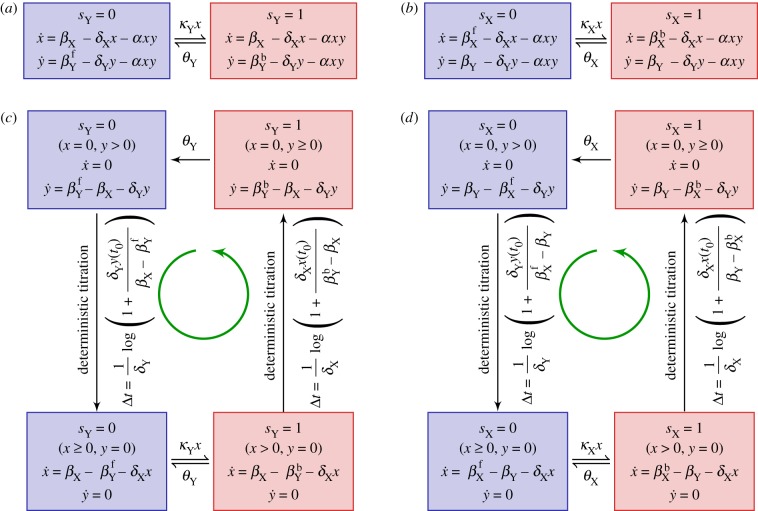
Figure 3.
Schematic diagrams of the derived piecewise deterministic Markov process (PDMP) for (a) idealized activator-titration circuit (ATC) and (b) idealized repressor-titration circuit (RTC). Both models have a single promoter site  . The linearized PDMP for ATC and RTC are shown in (c) and (d), respectively, where the green circular arrows indicates the direction of the emergent stochastic cycles. Dark blue
  and light red
  boxes denote promoter states with different production rates where
  and
and  , respectively. The transitions between the two regimes
  and (
and ( ) are due to titration. (Online version in colour.)

