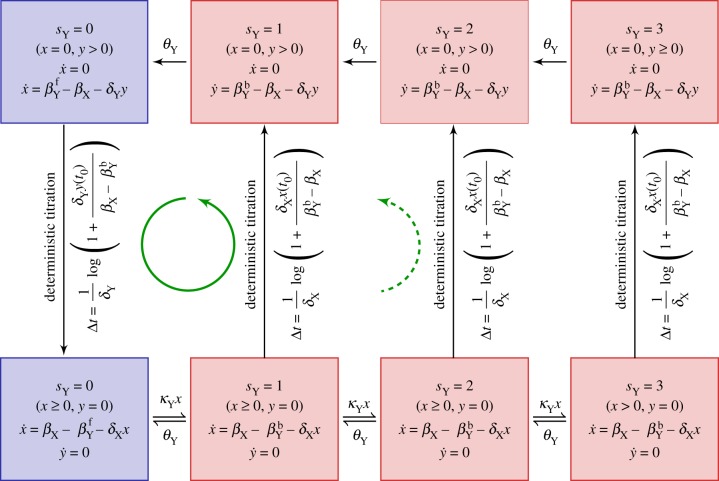
Figure 6.
Schematic diagram of the linearized PDMP describing the idealized ATC with multiple binding sites ( ) in the non-adiabatic regime. The green (circular) arrows indicates the emergent cycles which are predominantly observed in the simulations. The path of the dotted arrow is also observed, but less frequently (figure 11b). (Online version in colour.)

