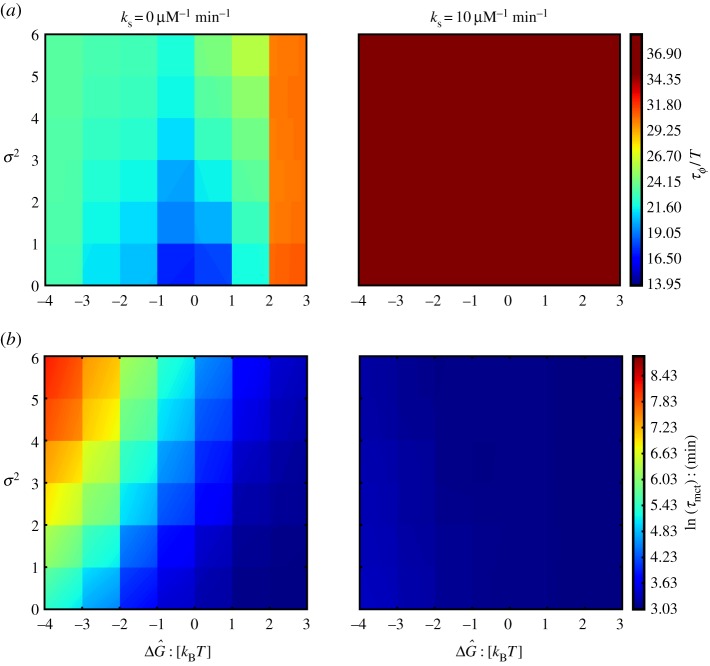
Figure 2.
(a) Oscillation quality (τϕ/T) as a function of mean ( ) and standard deviation (σ) of the distribution of unbinding rates from 2 × 10⁴ NFκB decoys (genomic sites except for the IκB promoter) when molecular stripping is disabled (
 ) and with molecular stripping enabled (
 ). (b) Log of mean clearance time ln(τmct) as a function of mean (
 ) and standard deviation of distribution of unbinding rates from 2 × 10⁴ NFκB decoys when molecular stripping is disabled (
 ) and with molecular stripping enabled (
 ). (Online version in colour.)

