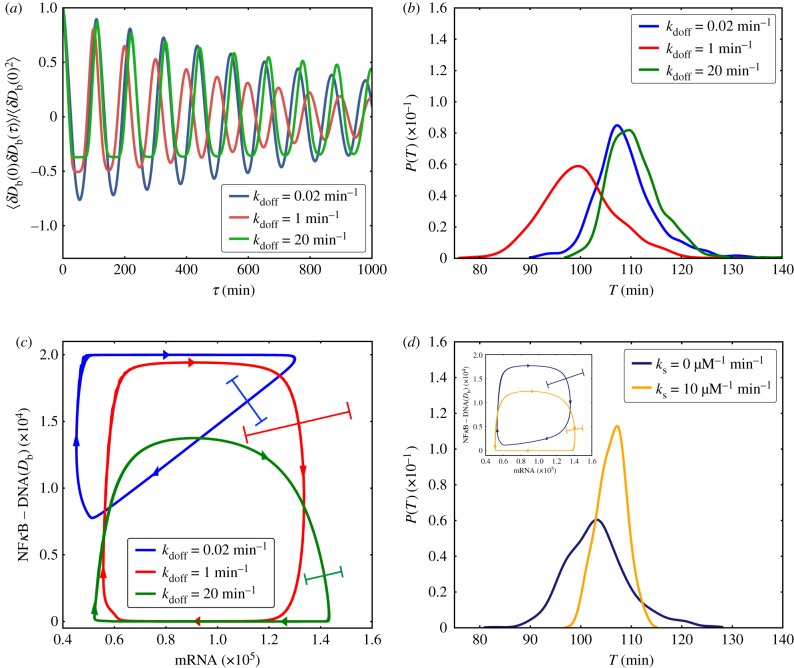
Figure 3.
(a) Normalized autocorrelation of NFκB–DNA (Db) population for 2 × 10⁴ identical NFκB decoys (NFκB genomic sites except for the IκB promoter) with different unbinding rates. (b) Distribution of oscillatory period (T) of the NFκB–DNA (Db) population for different unbinding rates of identical NFκB decoys (number = 2 × 10⁴). (c) Limit cycles in the phase space of ensemble averaged numbers of NFκB–DNA (Db) and mRNA species, with different unbinding rates of identical NFκB decoys (number = 2 × 10⁴). The error bars show the noise-level associated with each limit cycle. (d) Distribution of oscillatory period (T) of NFκB–DNA (Db) population for the case of 2 × 10⁴ distributed NFκB decoys whose unbinding rates follow a lognormal distribution with mean lnkdoff = 0 and σ2 = 6. Two scenarios are presented: with molecular stripping (dark blue lines) and without molecular stripping (orange lines). The inset shows the limit cycles as a function of numbers of NFκB–DNA (Db) and mRNA species. (Online version in colour.)

