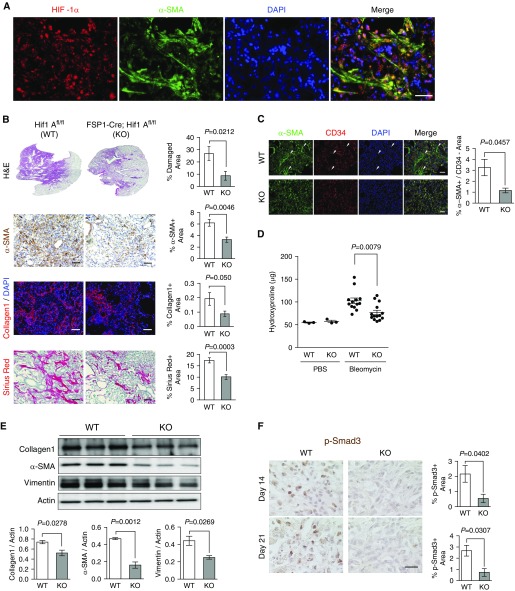
Figure 1.
Fibroblast-specific protein (FSP) 1–driven fibroblast hypoxia-inducible factor (Hif) 1A ablation attenuates pulmonary fibrosis. (A) Representative immunofluorescent images of colocalized HIF-1α (red) and α-smooth muscle actin (α-SMA; green) in bleomycin-induced fibrotic lung tissues. (B) Representative images and quantification of wild-type (WT; Hif1Afl/fl) and FSP1-driven, Cre recombinase (Cre)-mediated, fibroblast-specific Hif1A knockout (KO; FSP1-Cre; Hif1Afl/fl) composite hematoxylin and eosin (H&E) montage images of whole lung lobes, α-SMA immunohistochemistry (IHC), immunofluorescent collagen, and Sirius red staining (n = 6–8 per group, 10–15 images per mouse were captured for quantification). (C) Representative images of α-SMA (green) and CD34 (red) double-immunofluorescent staining and quantification of α-SMA+/CD34− areas in WT (n = 5) and fibroblast-specific Hif1A KO mice (n = 3, 8–10 images per mouse were captured for quantification). Arrowheads indicate α-SMA+/CD34− areas. (D) Lung hydroxyproline content of WT and fibroblast Hif1A KO mice treated with PBS or bleomycin (n = 3 per PBS-treated group, n = 14 per bleomycin-treated group). (E) Western blot analysis and quantification of lung collagen (Col) 1, α-SMA, and vimentin expression in WT and fibroblast Hif1A KO mice treated with bleomycin (n = 3 per group). (F) Representative images and quantification of phosphorylated (p)-Smad3 IHC in WT and fibroblast Hif1A KO mice 14 days (n = 4 per group) and 21 days (n = 3 per group) after bleomycin treatment. Scale bar: 25 μm. All other scale bars: 100 μm. Error bars represent the mean (±SEM). Two-tailed t test.

