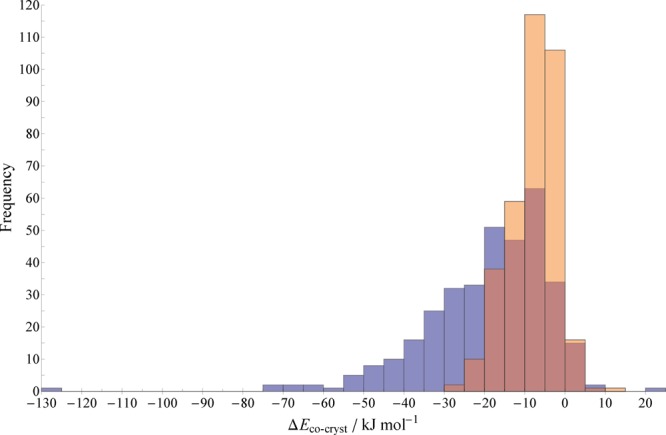
Figure 1.

Distributions of calculated (PBE+D3) relative stabilities (defined in eq 1) for the full set of 350 cocrystals relative to their corresponding single-component structures. Blue bars are the energy per formula unit of the cocrystal (as defined within its CSD entry), while orange bars are the energy per molecule (the dark regions of bars indicate overlap). Values are expressed in kJ mol–1 and collected into bins of width 5 kJ mol–1.
