
Figure 8.
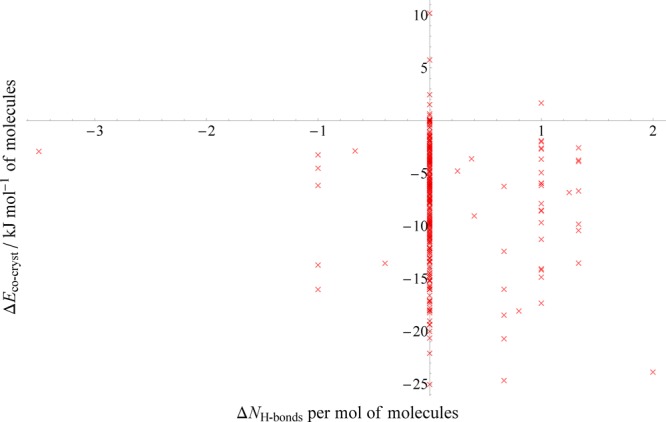
PBE+D3 relative stabilities of cocrystals plotted against the overall change in the number of hydrogen bonds per molecule upon forming the cocrystal. Positive values indicate more hydrogen bonds in the cocrystal. Only the 292 cocrystals from our set in which hydrogen bonding occurs are plotted here; 281 from the hydrogen-bonded subset (287-6 that underwent proton transfer) and 11 additional structures in the halogen-bonded subset.