Figure 1.

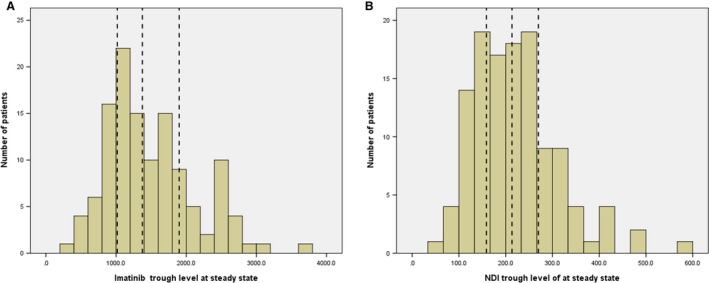
The distribution of the steady‐state trough plasma concentrations of Imatinib (A) and NDI (B) at 400 mg daily (n = 122). The vertical dashed lines indicate quartiles. (NDI: N‐desmethyl Imatinib)

The distribution of the steady‐state trough plasma concentrations of Imatinib (A) and NDI (B) at 400 mg daily (n = 122). The vertical dashed lines indicate quartiles. (NDI: N‐desmethyl Imatinib)