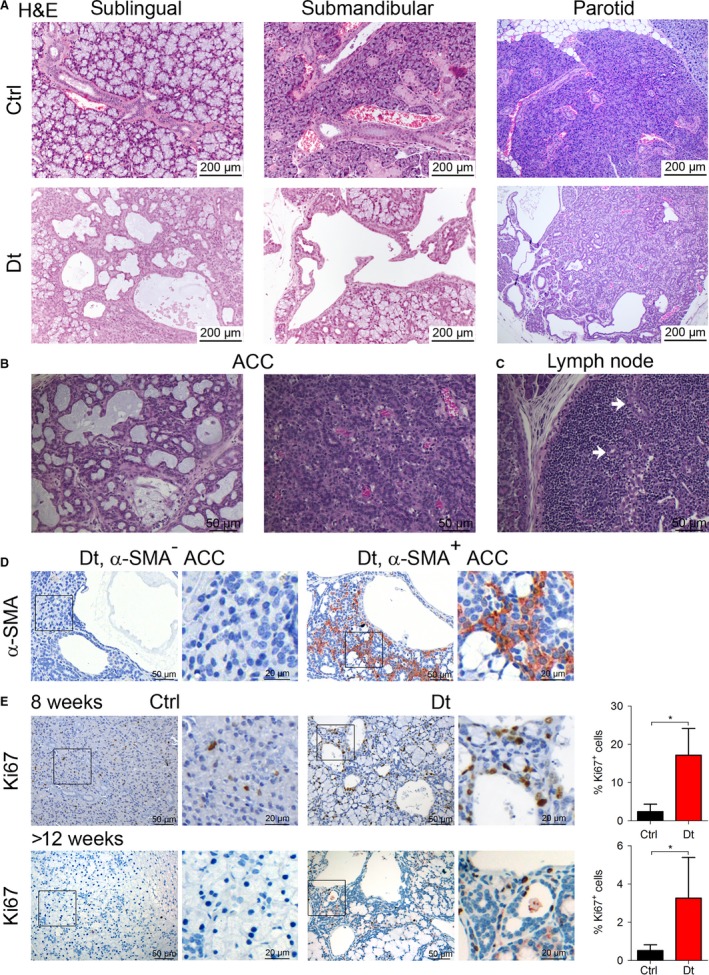
Figure 2.

Tumors show an adenoid cystic carcinoma pathology. (A) Representative H&E stainings of sublingual, submandibular, and parotid glands in Ctrl versus Dt mice. (B). H&E staining of adenoic cystic carcinoma of the salivary gland depicting the typical large cystic spaces and small pseudoglandular spaces covered by cuboidal cells (left) and microglandular pattern with solid areas. The proteinaceous material is stained in violet. (C) H&E staining of a newly formed lymph node. White arrows indicate infiltrating carcinomas. (D) ACC in Dt mice show negative and positive areas for α‐SMA staining (E) Representative pictures of immunohistochemistry for the proliferation marker Ki67 of salivary gland sections of Ctrl and tumor‐bearing Dt mice at 8 weeks and >12 weeks of age. Ki67+ were quantified using TissueQnostic software. Data are presented as mean ± sd and were analyzed by Student's t‐test (n = 3, *P < 0.05).
