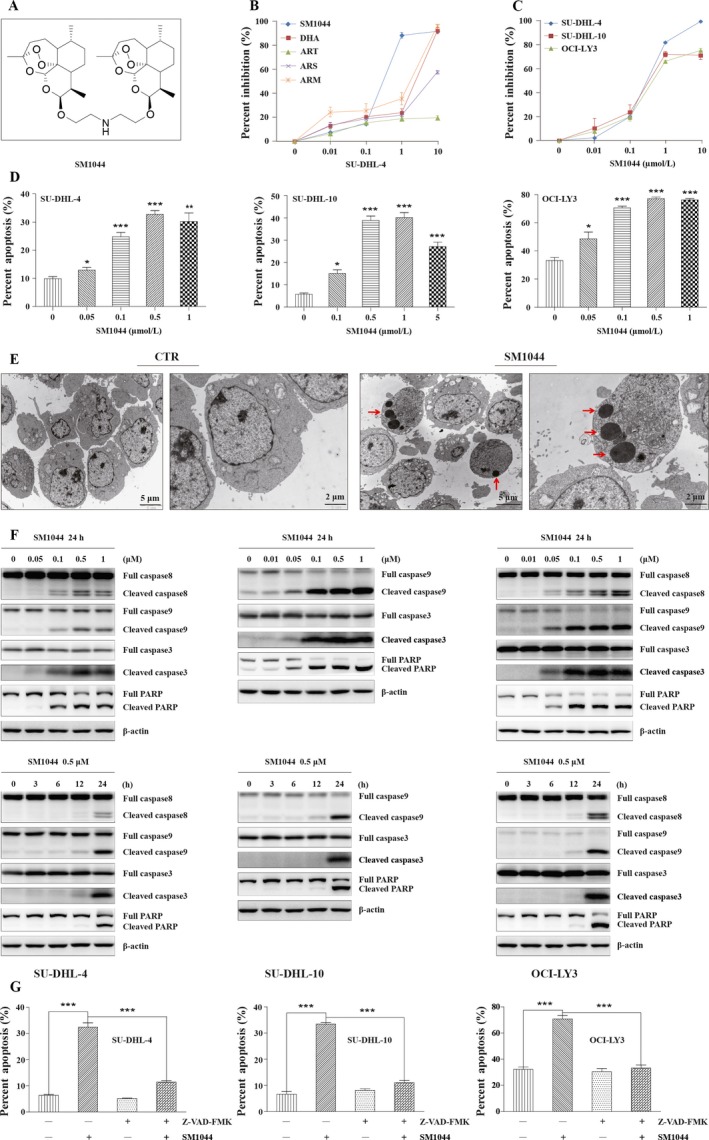
Figure 1.

SM1044 induces caspase‐dependent apoptosis in DLBCL cell lines. (A) Structural formula of SM1044. (B) SU‐DHL‐4 cells were treated with the indicated concentrations of SM1044, DHA, ART, ARS, and ARM for 24 h, respectively. Cell viability was measured by CCK‐8 and the percent inhibitions were calculated (mean ± SEM, n = 3). (C) SU‐DHL‐4, SU‐DHL‐10, and OCI‐LY3 cells were treated with the indicated concentrations of SM1044 for 24 h. The cell viability was measured by CCK‐8 and the percent inhibitions were calculated (mean ± SEM, n = 3). (D) SU‐DHL‐4, SU‐DHL‐10, and OCI‐LY3 cells were treated with the indicated concentrations of SM1044 for 24 h. Cell apoptosis was detected by flow cytometry using the FITC‐Annexin V/PI apoptosis detection kit (mean ± SEM, n = 3). SU‐DHL‐4: 0 μmol/L versus 0.05 μmol/L, P = 0.042; 0.1 μmol/L, P < 0.001; 0.5 μmol/L, P < 0.001; 1 μmol/L, P = 0.0061. SU‐DHL‐10: 0 μmol/L versus 0.1 μmol/L, P = 0.023; 0.5 μmol/L, P < 0.001; 1 μmol/L, P < 0.001; 5 μmol/L, P < 0.001. OCI‐LY3: 0 μmol/L versus 0.05 μmol/L, P = 0.034; 0.1 μmol/L, P < 0.001; 0.5 μmol/L, P < 0.001; 1 μmol/L, P < 0.001. (E) SU‐DHL‐4 cells were treated with SM1044 for 24 h. Representative electron microscopy photomicrographs are shown. The red arrows point to the apoptosis bodies. (F) The expressions of caspase‐8, ‐9, ‐3, and PARP were detected by western blot in SU‐DHL‐4, SU‐DHL‐10, and OCI‐LY3 cells treated with the indicated concentrations of SM1044 for the indicated time courses. (G) Apoptosis was measured in SU‐DHL‐4, SU‐DHL‐10, and OCI‐LY3 cells pretreated with caspase inhibitor Z‐VAD‐FMK for 1 h, and then treated with SM1044 for another 24 h (mean ± SEM, n = 3). SU‐DHL‐4: SM1044 versus control, P < 0.001; SM1044 versus Z‐VAD‐FMK plus SM1044, P < 0.001. SU‐DHL‐10: SM1044 versus control, P < 0.001; SM1044 versus Z‐VAD‐FMK plus SM1044, P < 0.001. OCI‐LY3: SM1044 versus control, P < 0.001; SM1044 versus Z‐VAD‐FMK plus SM1044, P < 0.001. *P < 0.05, **P < 0.01, ***P < 0.001.
