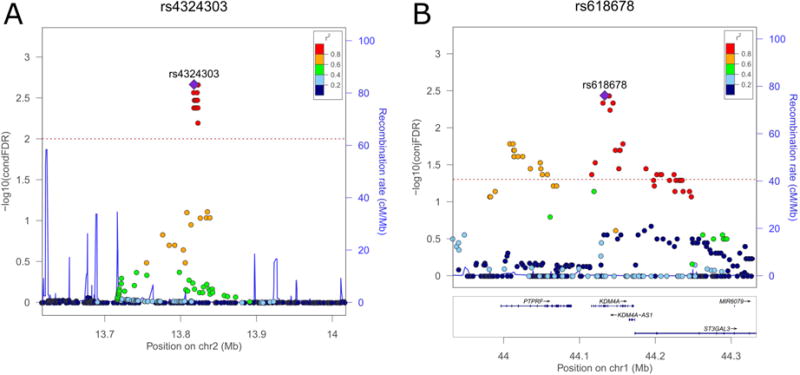
Figure 4.

Genetic context of the strongest associations identified in conditional false discovery rate (condFDR) (A) and conjunctional false discovery rate (conjFDR) (B) analyses. Note: Values for both genotyped and imputed variants are shown on the left y-axis as –log10(condFDR) and −log10(conjFDR), respectively. In each subplot, a single nucleotide polymorphism (SNP) with the strongest association is shown in the large purple square. The color of the remaining markers reflects the degree of linkage disequilibrium (LD) with the strongest-associated SNP measured as r2 coefficient (described in the legend). The recombination rate is plotted as a solid blue line; its value in centimorgan/megabase (cM/Mb) is indicated on the right y-axis. The red dotted lines indicate the FDR thresholds (0.01 for condFDR and 0.05 for conjFDR). A: surrounding of the strongest association in condFDR analysis: rs4324303 (condFDR = 2.17 × 10⁻³). B: surrounding of the strongest association in conjFDR analysis: rs618678 (conjFDR = 3.82 × 10⁻³). Figures are generated with LocusZoom.52
