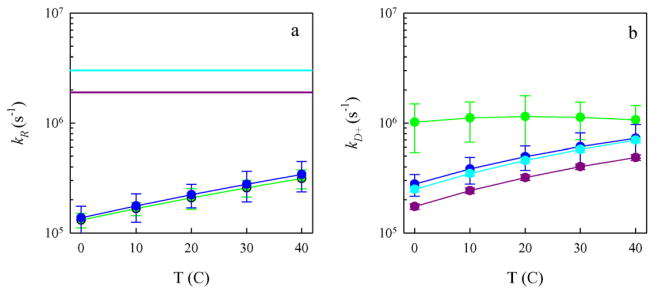
Fig. 4.
Reaction-limited (a) and diffusion-limited (b) rates for the full-length CWPAPf39 peptide at pH 7 (green), full-length CWPAPf39 peptide at pH 3.5 (blue), CWPAPf39Δ8 peptide at pH 7 (cyan), and CWPAPf39Δ8 peptide at pH 3.5 (purple). The rates and error bars were determined from the linear fits in Fig. 3. The horizontal lines in (a) were determined from the error in the intercept of Fig. 3c and d and represent lower limits of the reaction-limited rates. The diffusion-limited rates in (b) have been normalized by the viscosity of water at each temperature. (For interpretation of the references to colour in this figure legend, the reader is referred to the web version of this article.)

